🌍 Public
Victory!
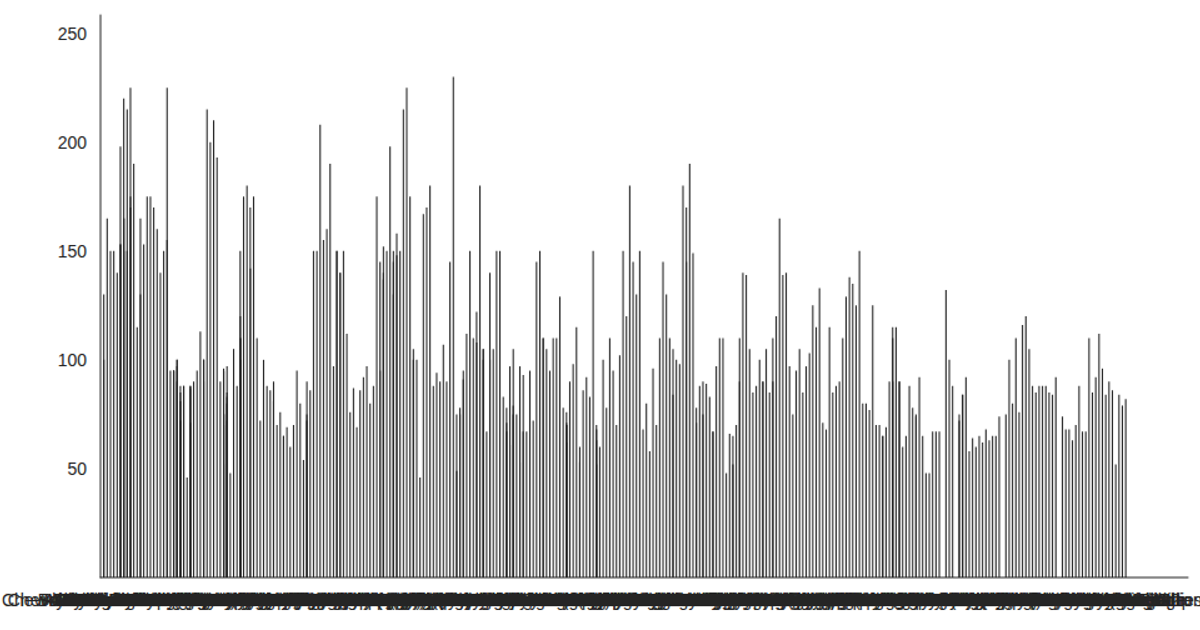
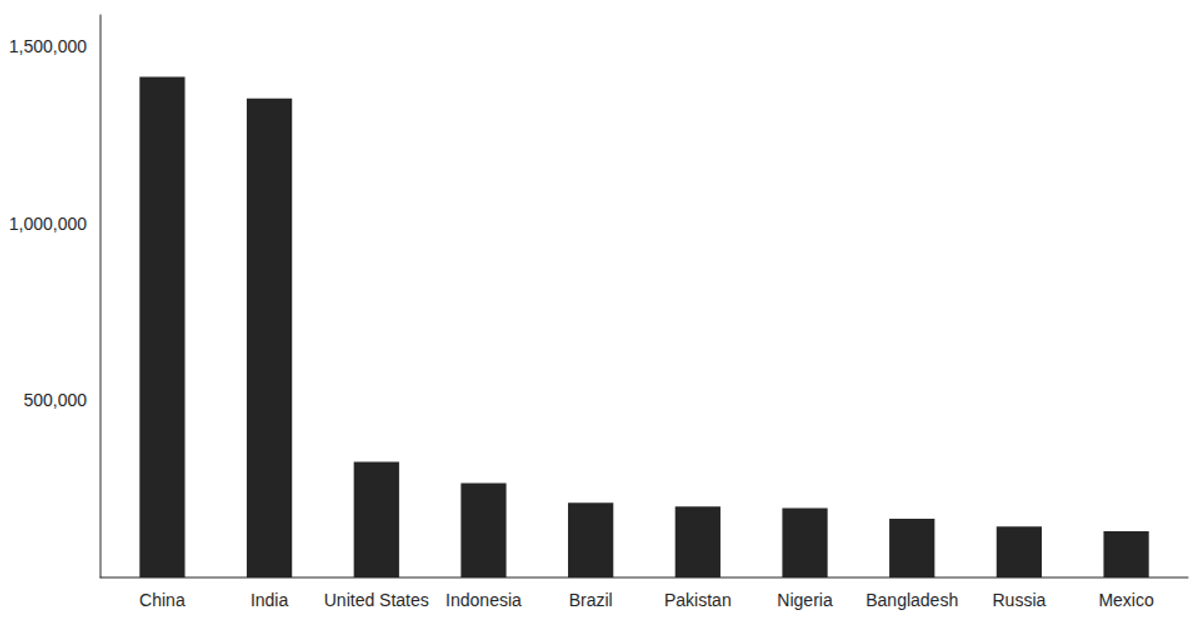
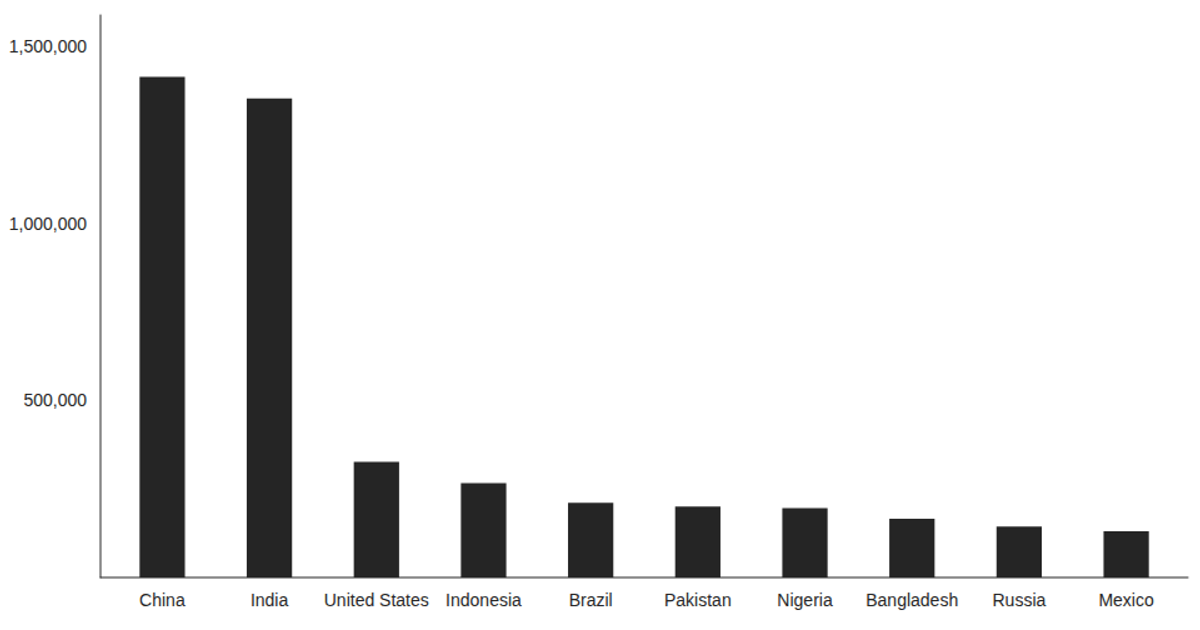
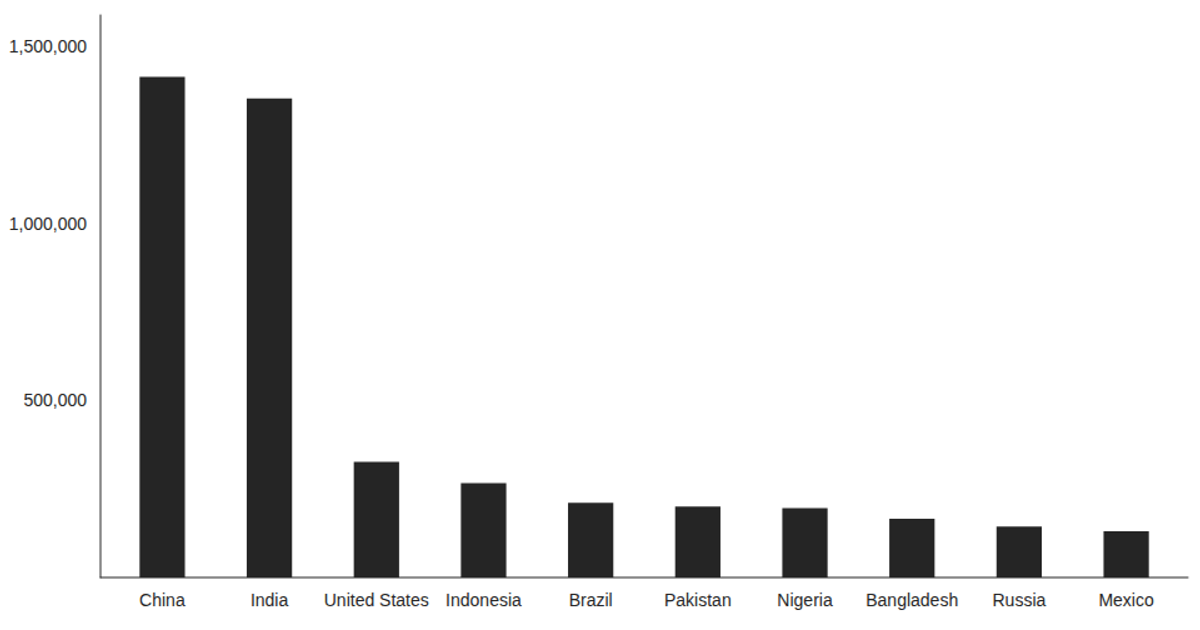
A bar chart displays brand comparison data with multiple metrics per brand, plotting three y-values (val_1, val_2, and mark_val) against Brand categories on the x-axis. The visualization uses Victory's VictoryBar and VictoryChart components within a React application, loading CSV data asynchronously via D3's `csv` function. The chart applies a large tick label font size, custom domain padding, and explicit chart dimensions and padding, with data sourced from a local graph.csv file.
AI-generated descriptionThis example shows how to load data from a CSV file using React hooks and visualize the result using Victory Charts. Inspired by this Victory example from Swizec Teller in React for Data Visualization.
MIT Licensed




Comments
Sign in to join the discussion.