🌍 Public
Victory!
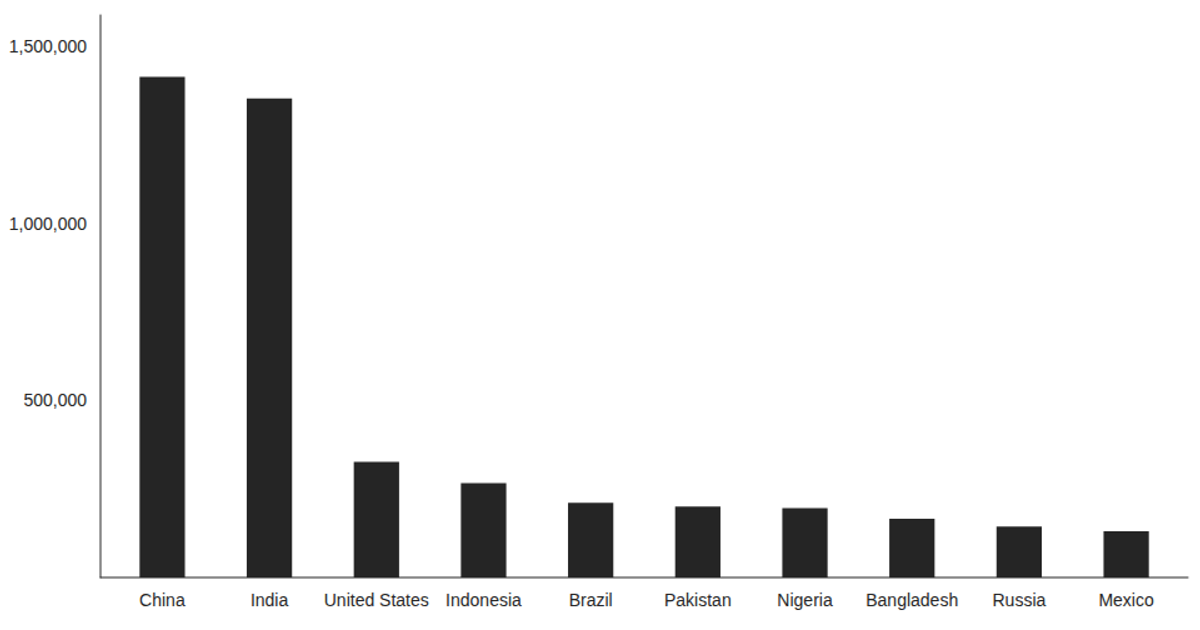
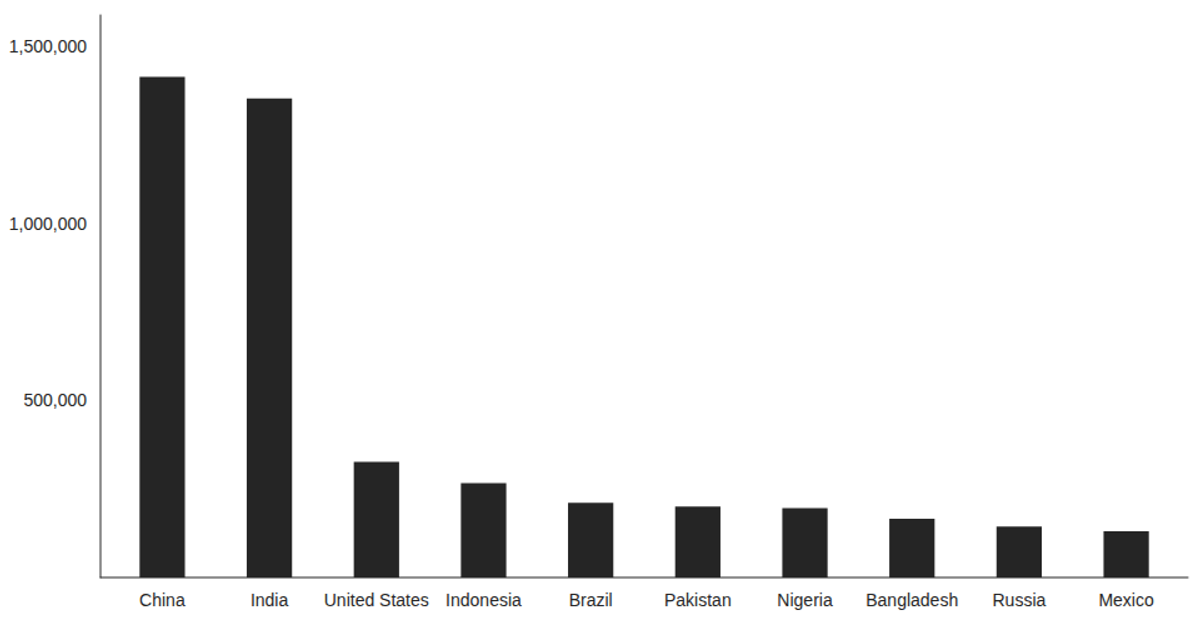
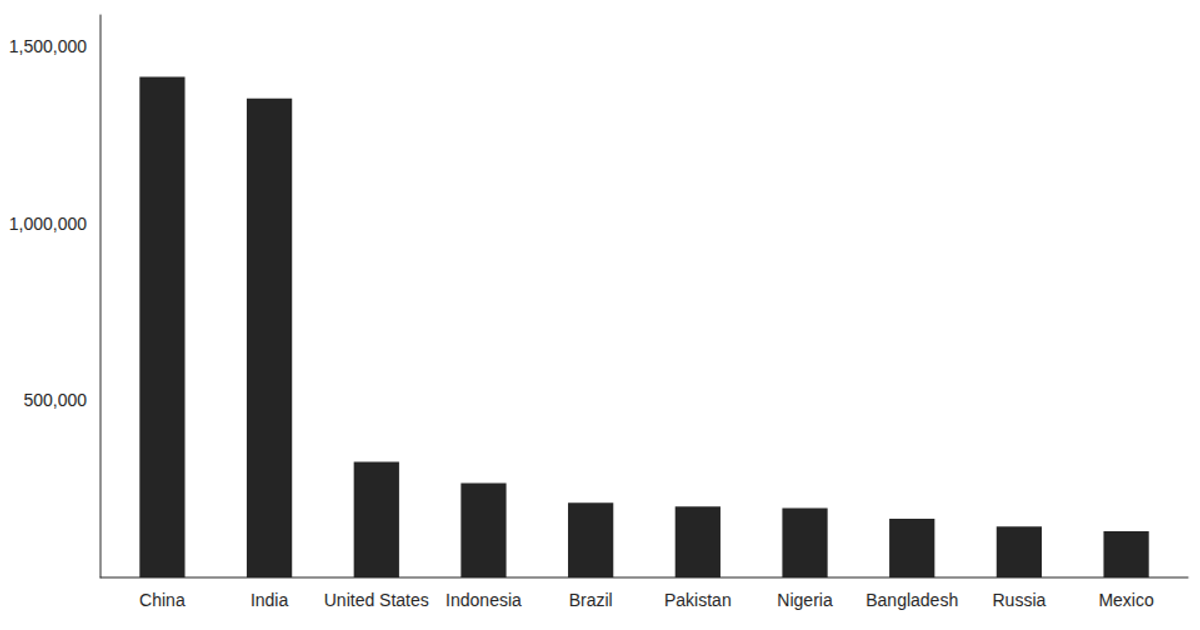
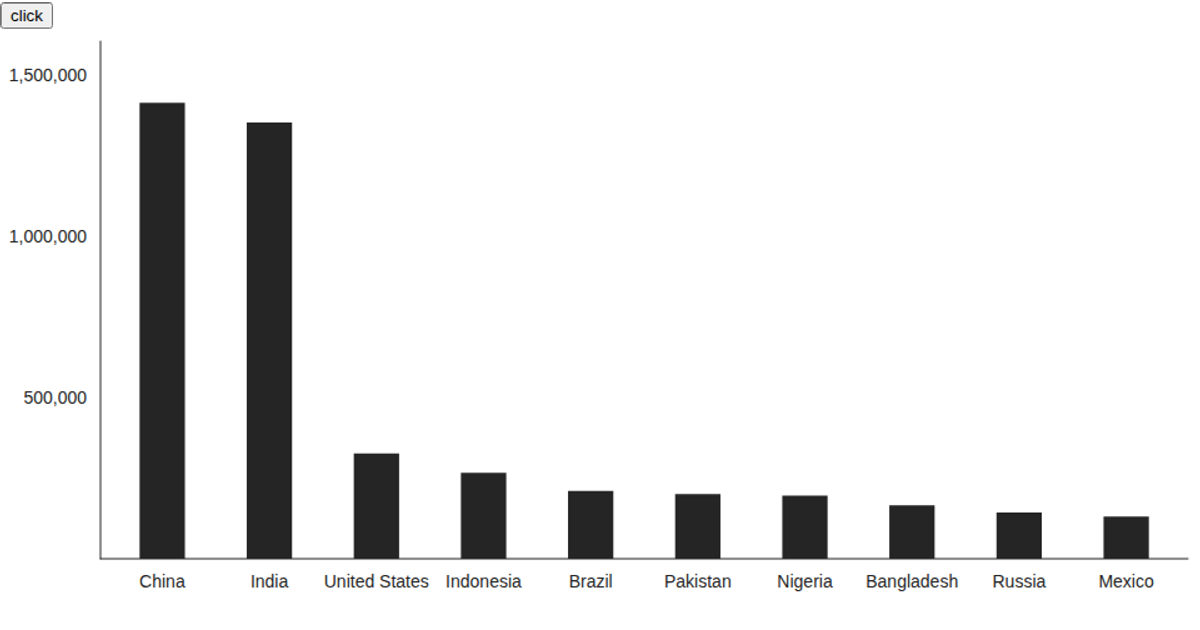
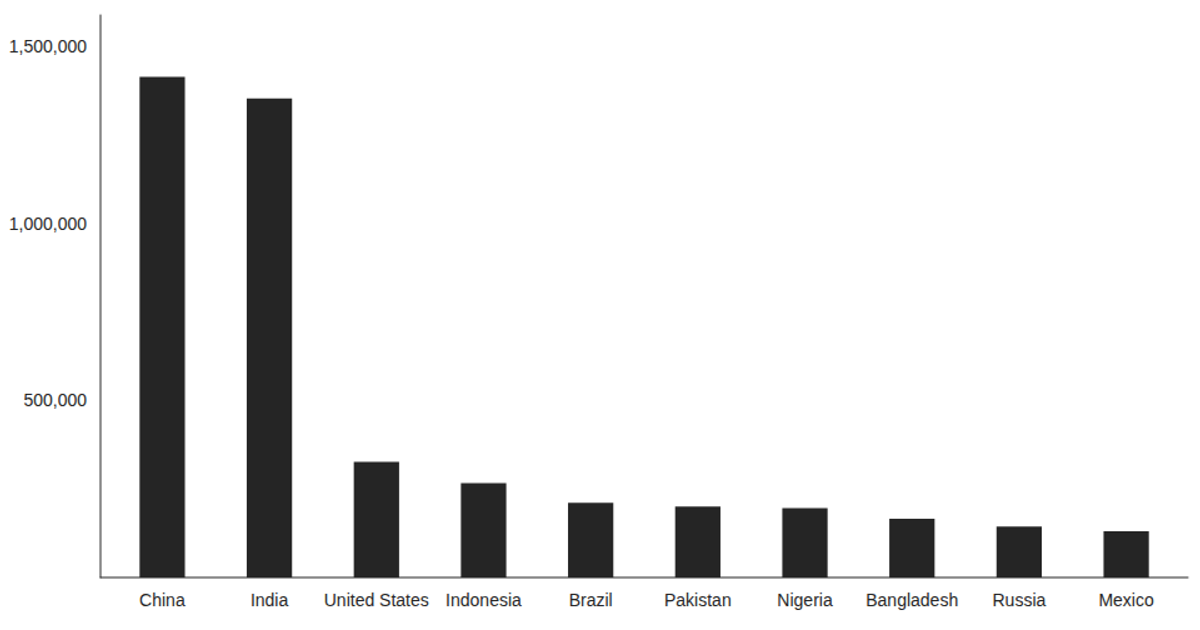
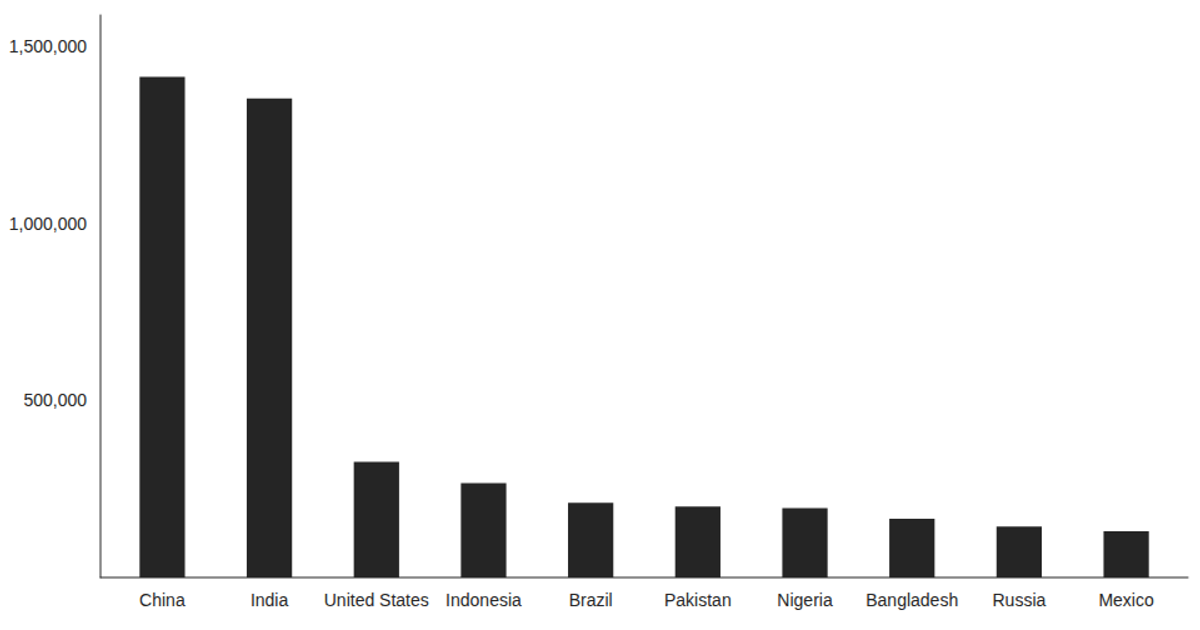
A bar chart displays population figures for ten countries, from China to Mexico. The visualization loads a CSV file using the d3.csv function and renders the data with Victory’s VictoryBar and VictoryChart components. The chart uses a React hook (useEffect) to fetch data, and the code applies a custom style with large tick label fonts.
AI-generated descriptionThis example shows how to load data from a CSV file using React hooks and visualize the result using Victory Charts. Inspired by this Victory example from Swizec Teller in React for Data Visualization.
MIT Licensed


Comments
Sign in to join the discussion.