🌍 Public
Fork of CV: Pseudo Scatter Plot
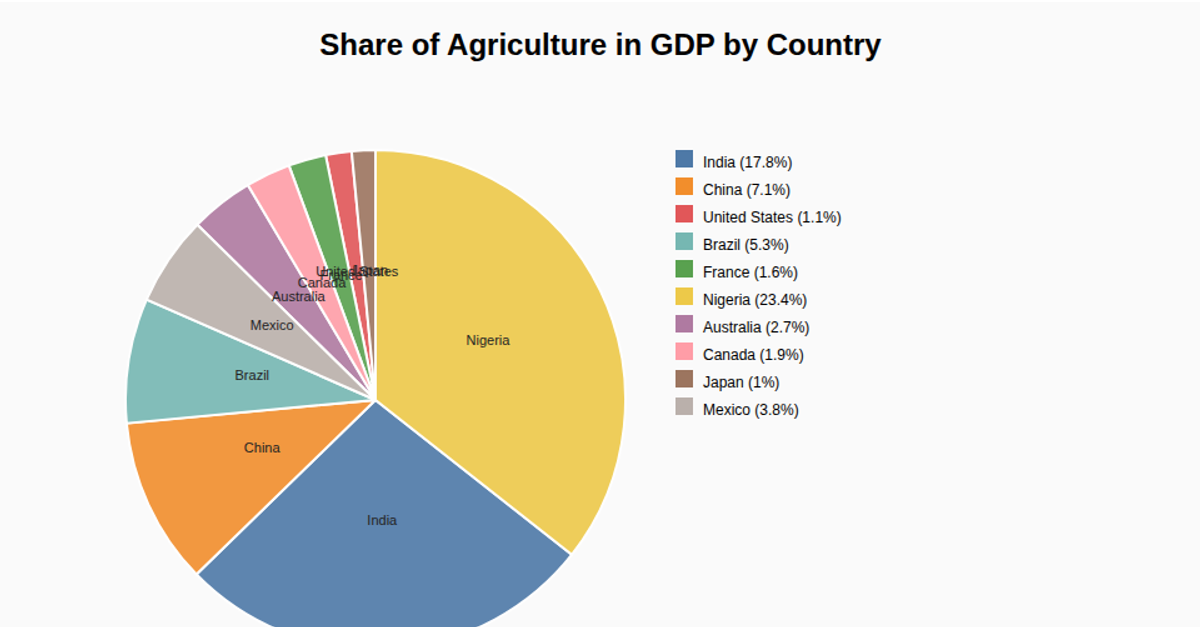
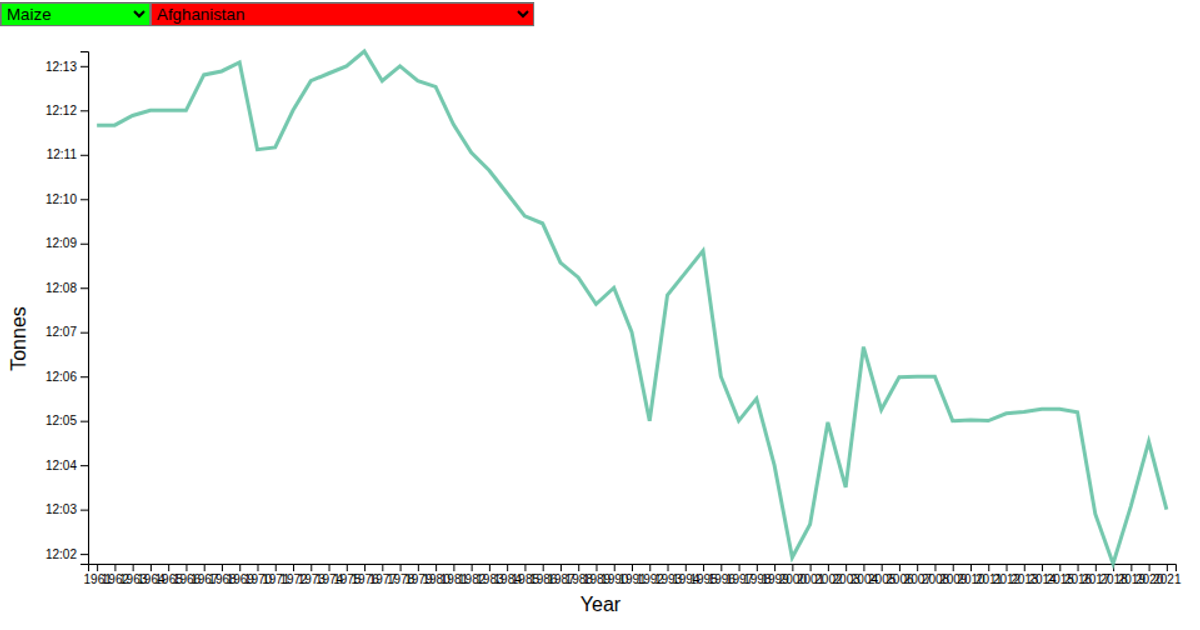
This dashboard presents a collection of agricultural production charts for the world's top countries, using a multi-page website format. It includes an area chart showing production contributions over time, a bar chart comparing output across countries and products, and a line chart depicting yearly production trends. The site is built with Vue and features a Tailwind CSS-based interface, with navigation managed through JavaScript to load different chart views. Each chart is presented as a static PNG image with accompanying descriptive text within the dark-themed interface.
AI-generated descriptionMIT Licensed






Comments
Sign in to join the discussion.