🌍 Public
Departamentos Argentina - interactivo
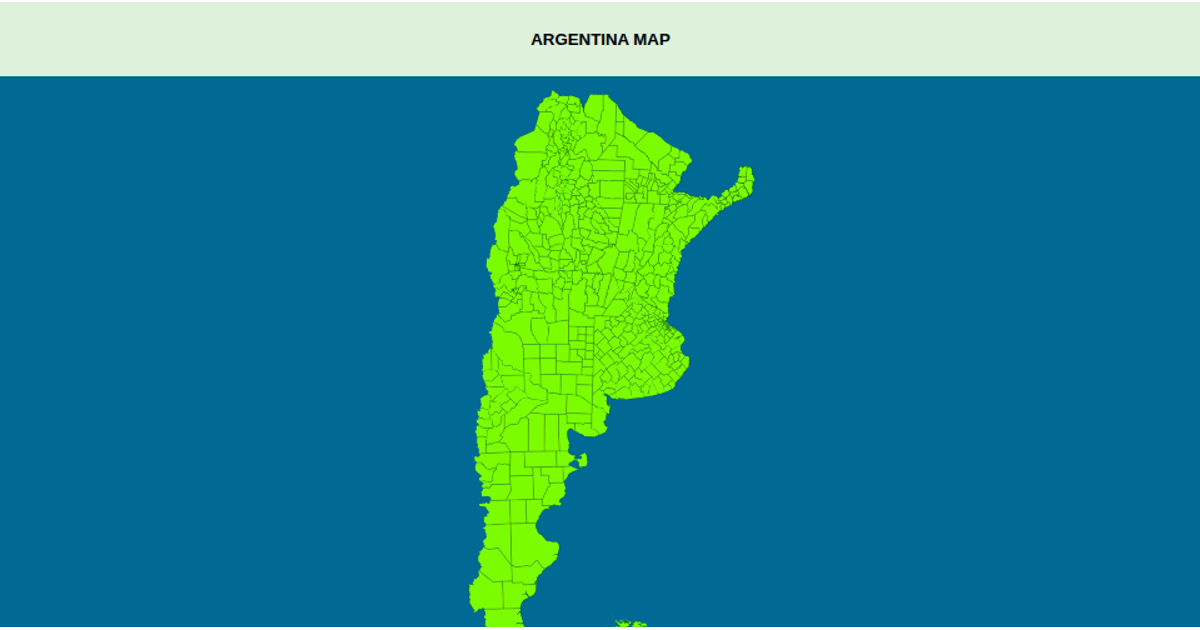
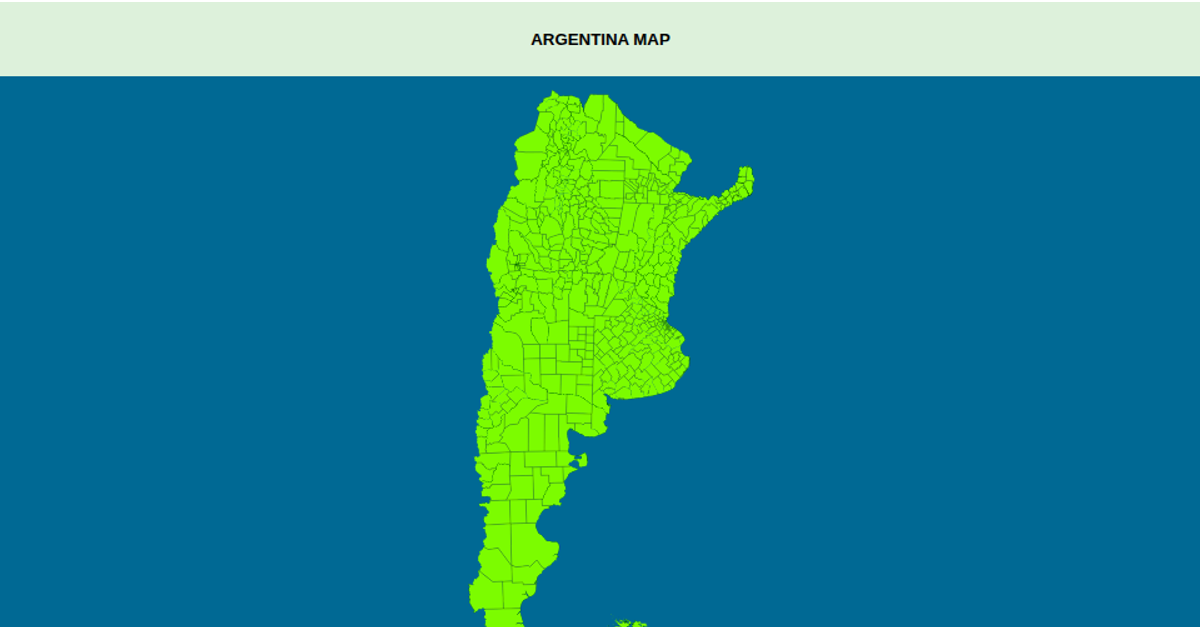
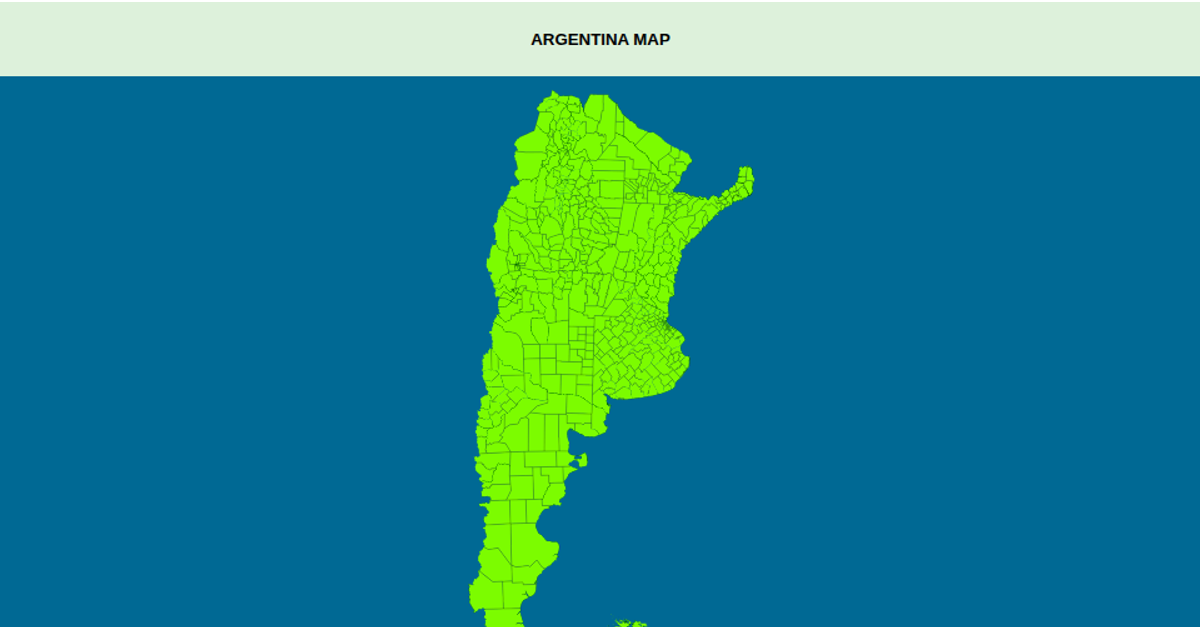
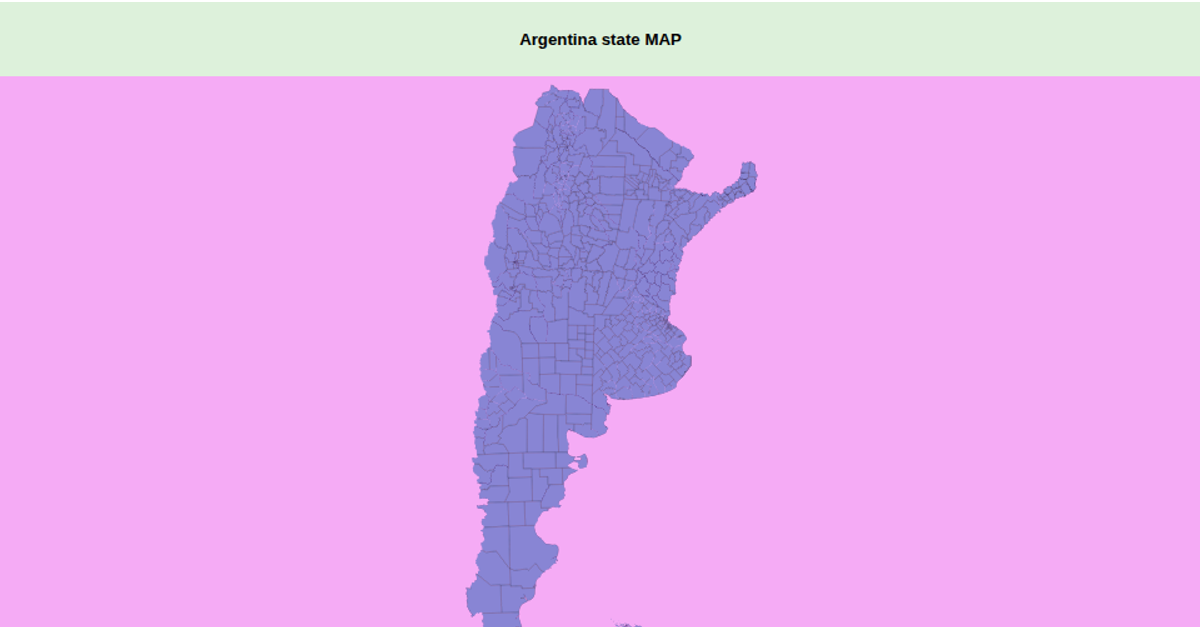
This interactive visualization displays a zoomable map of Argentina’s departments, with each region filled in light green and labeled by its department and province in a hover tooltip. Built with D3.js and the d3-geo-projection extension, it uses a transverse Mercator projection centered on the country and renders geographic paths as SVG elements. The map draws from a public GeoJSON dataset of Argentine departments, while a zoom interaction, implemented via D3’s `zoom` event, adjusts the map’s transform. Hovering changes the fill color to pink, and the sphere background is light blue.
AI-generated descriptionMIT Licensed




Comments
Sign in to join the discussion.