Radial Stacked Bar Chart With Brushing of Personal Electric Usage Data By Year for Account
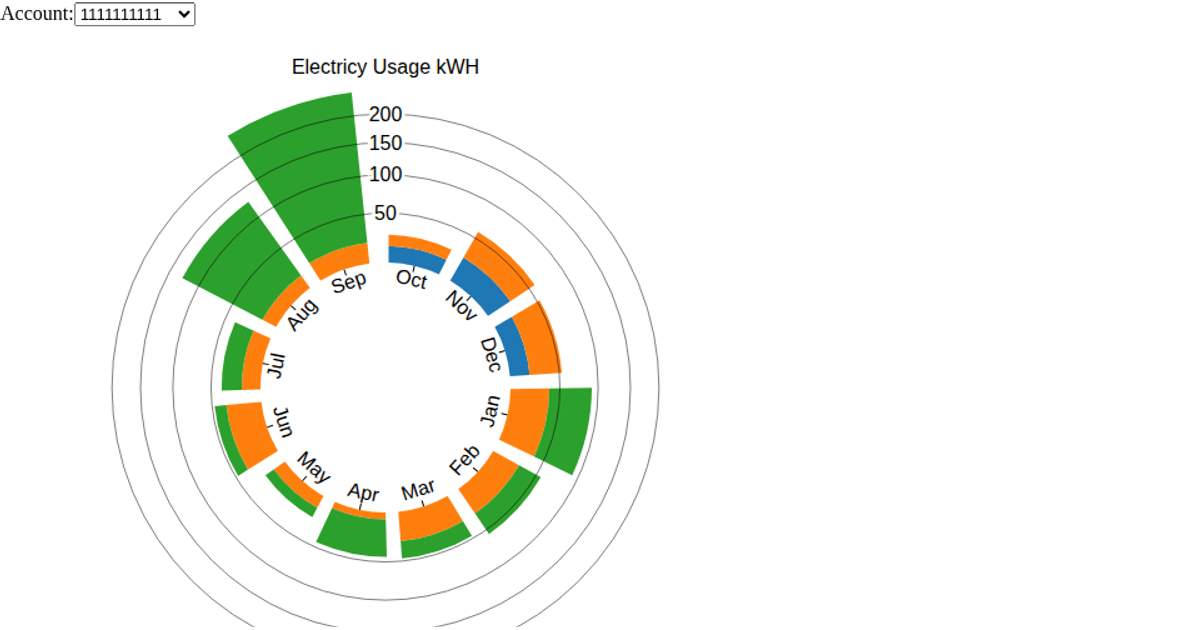
A radial stacked bar chart visualizes monthly electric usage (total kWh) per account across multiple years, with each ring segment representing a year and each bar representing a month. A linked context bar chart shows yearly totals and includes a brush (d3.brushX) to filter the displayed date range. The code uses d3.scaleBand, d3.scaleRadial, d3.arc, and d3.stack to construct the visualization, with data loaded from a CSV file. SVG and canvas rendering are supported, and transitions animate updates when the brush or account menu changes.
AI-generated descriptionThe context graph shows the years that the electrical data is over with a brush to limit the range. I think the brush would be more effective for data over more than 3 years, and I plan on synthesizing data to create a wider range (10 years or more).
I was almost able to get the filtering to work; however, I ran into a situation where I was endlessly recursing in the brush function since I called back to re-render the graph and the brush function got called again. I suspect I need to separate the brush bar graph out into a separate file and function so that I can call the refresh on the readial stacked bar chart. I will have to work on that the remainder of this week.



Comments
Sign in to join the discussion.