🌍 Public
Episode 8 - Inicio
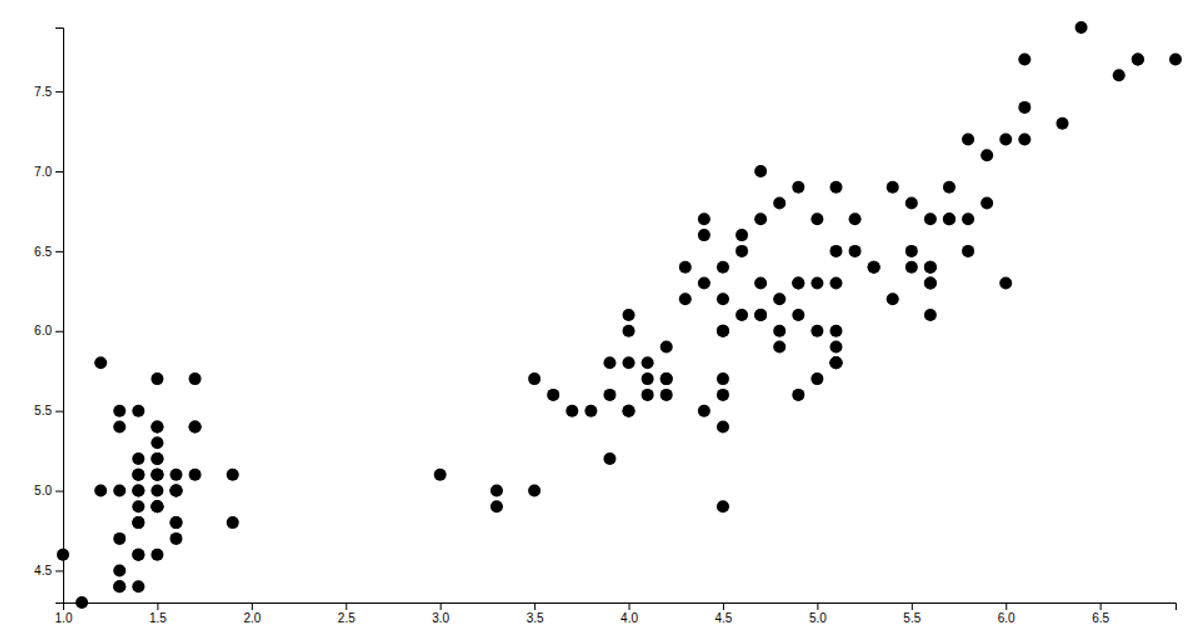
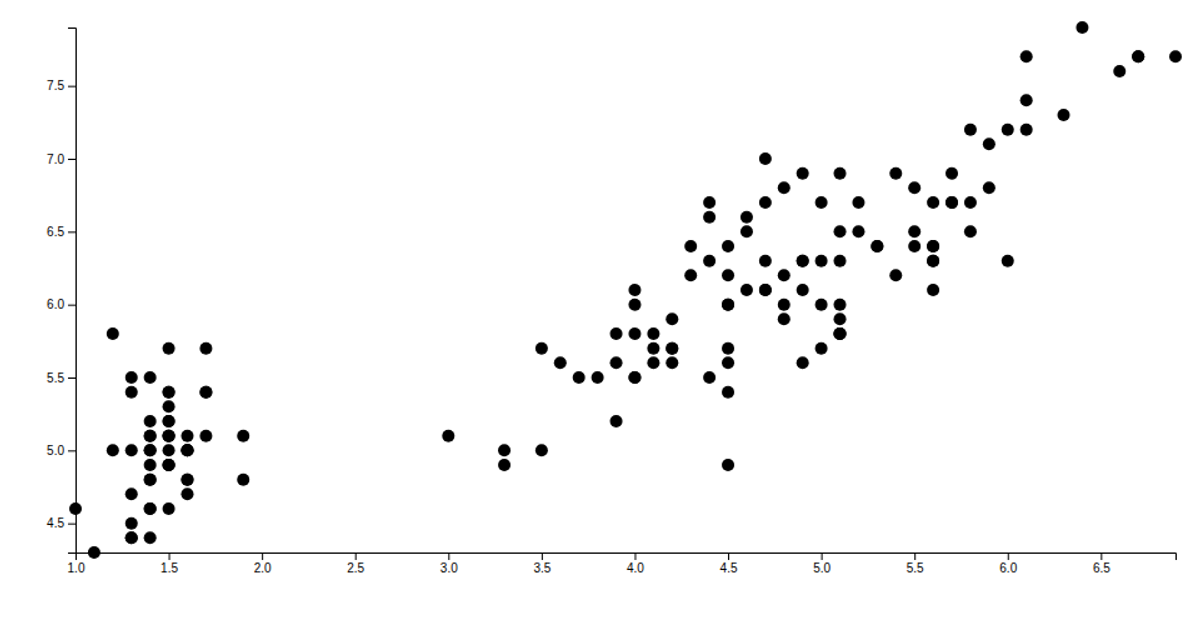
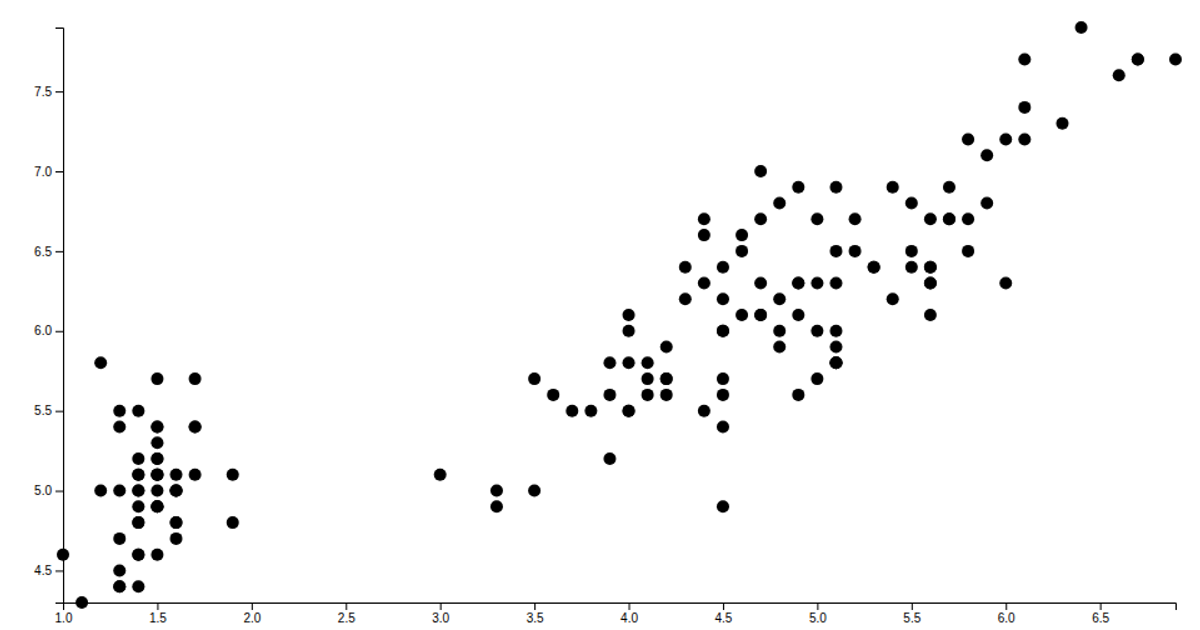
This visualization displays a scatter plot of the Iris dataset, mapping petal length on the x-axis against sepal length on the y-axis. Each of the 150 data points is rendered as a circle in an SVG, using scaled linear axes with margins. The code loads the data via `d3.csv`, parses numeric fields, and creates circles with `selectAll` and `join`. It appends bottom and left axes using `axisBottom` and `axisLeft`, while sizing the chart to the full browser window.
AI-generated descriptionMIT Licensed



Comments
Sign in to join the discussion.