🌍 Public
Got Error Fork of Covid-19 death with Voronoi II
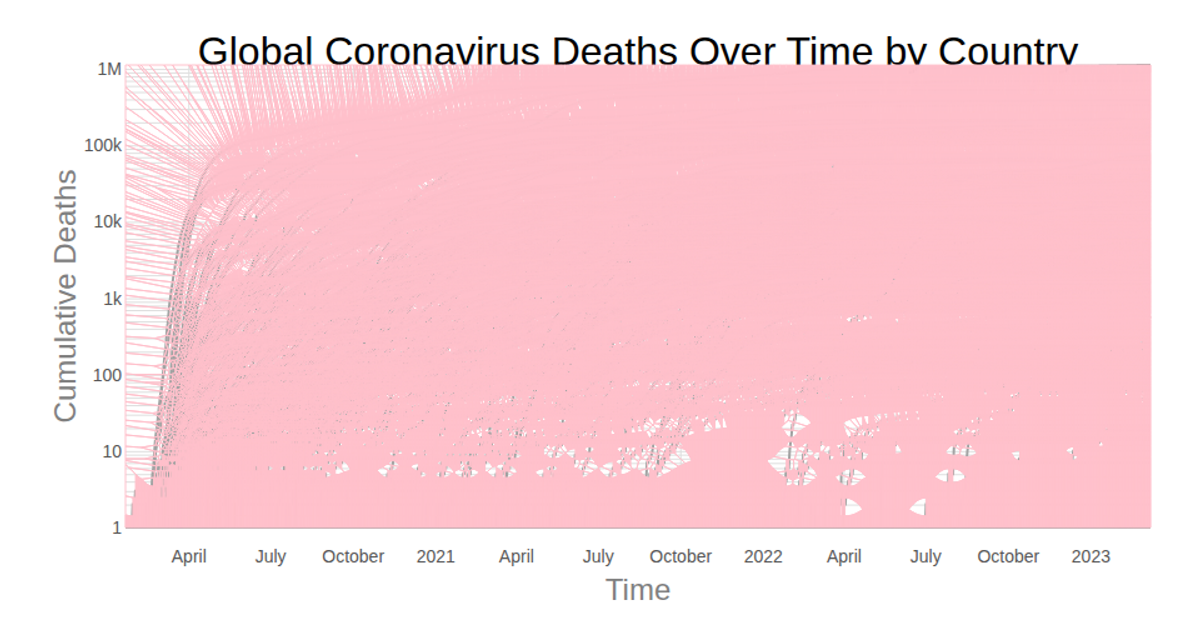
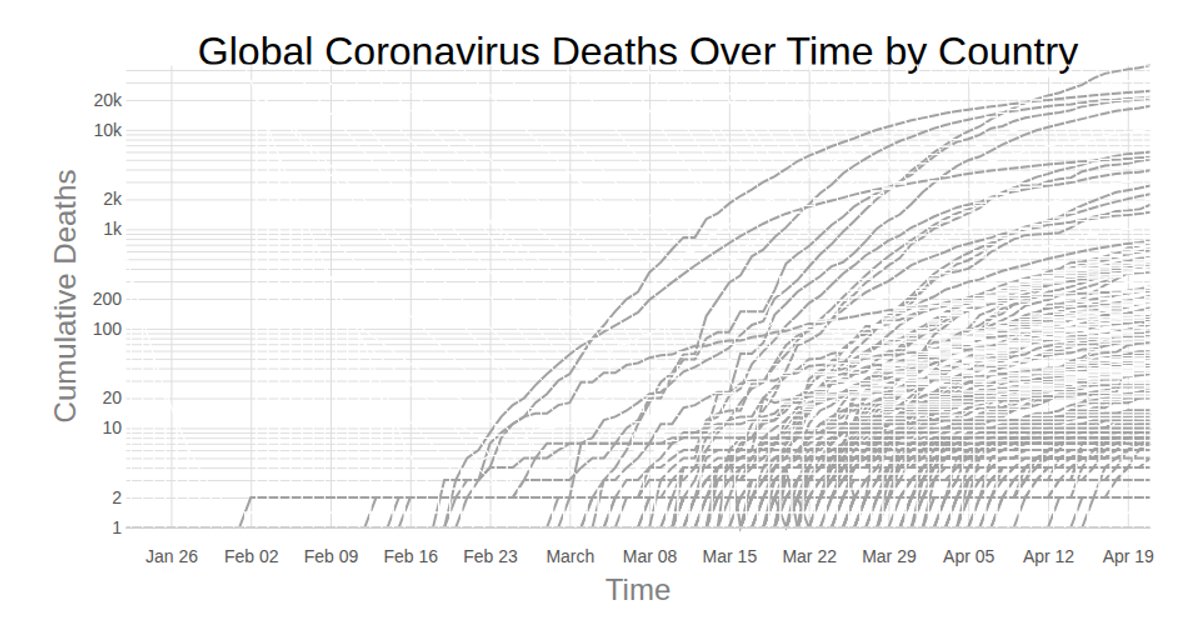
This visualization displays global COVID-19 death totals over time as a multi-series line chart, with a logarithmic y-axis to accommodate wide value ranges. Hovering over any point via a Voronoi overlay highlights the corresponding country’s full time series. Built with React and D3 v5, it uses `d3.scaleLog`, `d3.scaleTime`, `d3.line` with `curveNatural`, and `d3.Delaunay` for the interactive overlay. Data comes from the CSSEGISandData COVID-19 GitHub repository, rendered as SVG paths with axis labels and marker lines.
AI-generated descriptionMIT Licensed


Comments
Sign in to join the discussion.