🌍 Public
Fork of Fork of Coravirus Deaths Over Time by Country by Voronoi whit labels
Yyuva24
Last edited Jan 29, 2021
Created on Jan 29, 2021
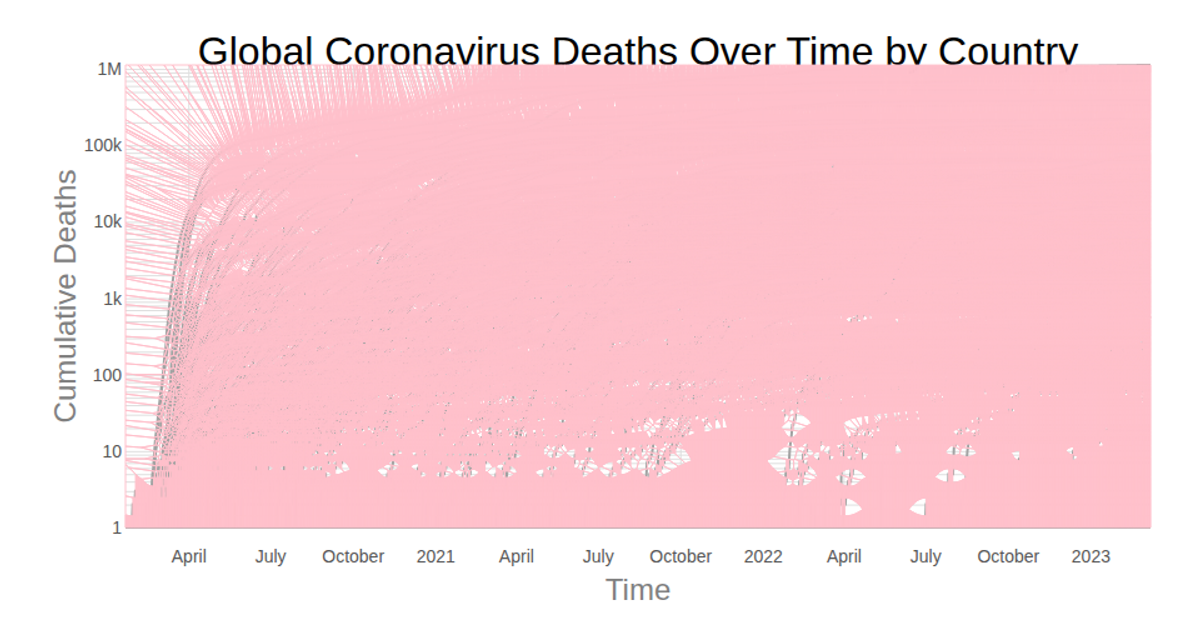
A multi-line chart displays cumulative COVID-19 deaths over time for each country, sourced from the CSSEGISandData GitHub repository. The rendering uses React with D3 v5, employing `scaleLog` for the y-axis and `scaleTime` for the x-axis. A Voronoi overlay, built with `d3.Delaunay`, enables hover interactions that highlight the active country’s line and display a tooltip with its name, death count, and date. SVG paths render all series, with gridlines and axis labels from `d3.axisBottom` and `d3.axisLeft`.
AI-generated descriptionSmiley face implementation with React & D3, taking full advantage of React components and ES6 modules.
MIT Licensed


Comments
Sign in to join the discussion.