🌍 Public
Poverty vs Wealth in the World
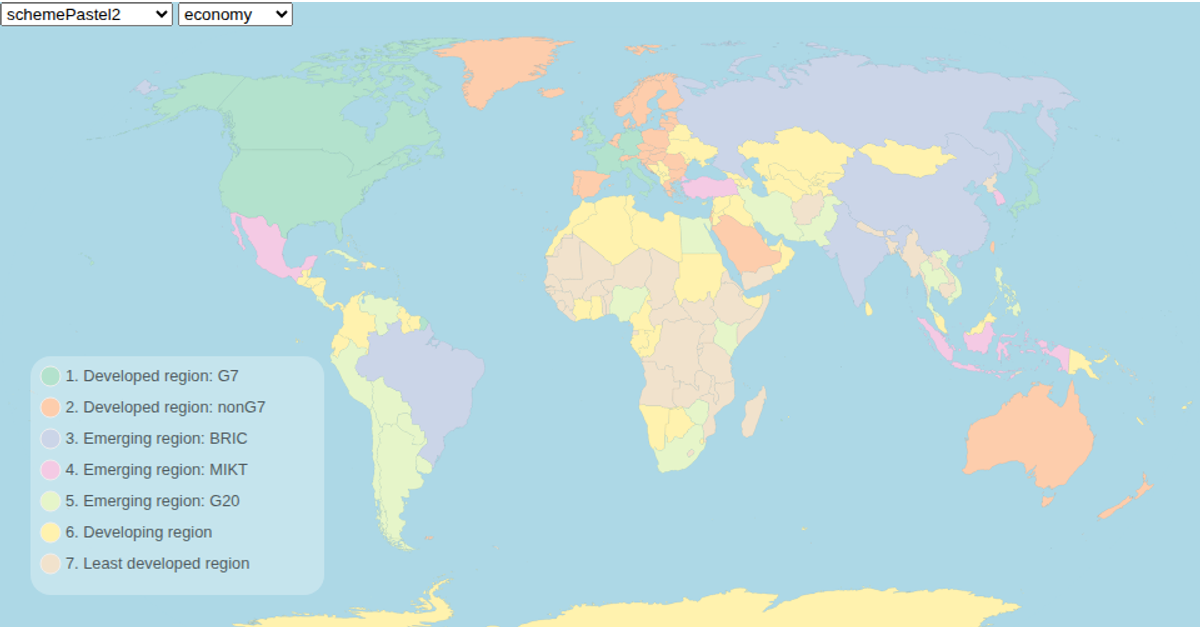
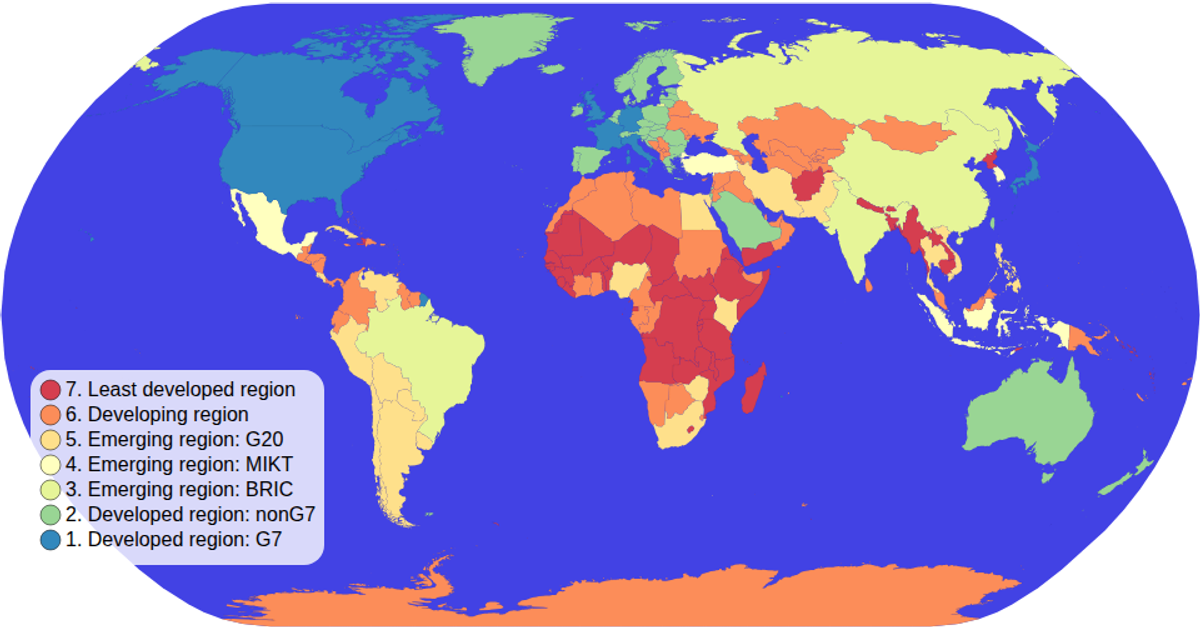
This map visualization depicts global economic disparity by coloring each country according to its economy category, with a legend allowing users to filter countries by category and a clickable map to select individual nations. Using D3’s `geoNaturalEarth1` and `geoPath` for the projection and rendering, it loads geospatial data from the world-atlas TopoJSON and applies an ordinal color scale with `schemeOranges`. Pan and zoom are enabled via `d3.zoom`, while country titles and labels provide tooltips and interactive feedback.
AI-generated descriptionMIT Licensed




Comments
Sign in to join the discussion.