🌍 Public
World map
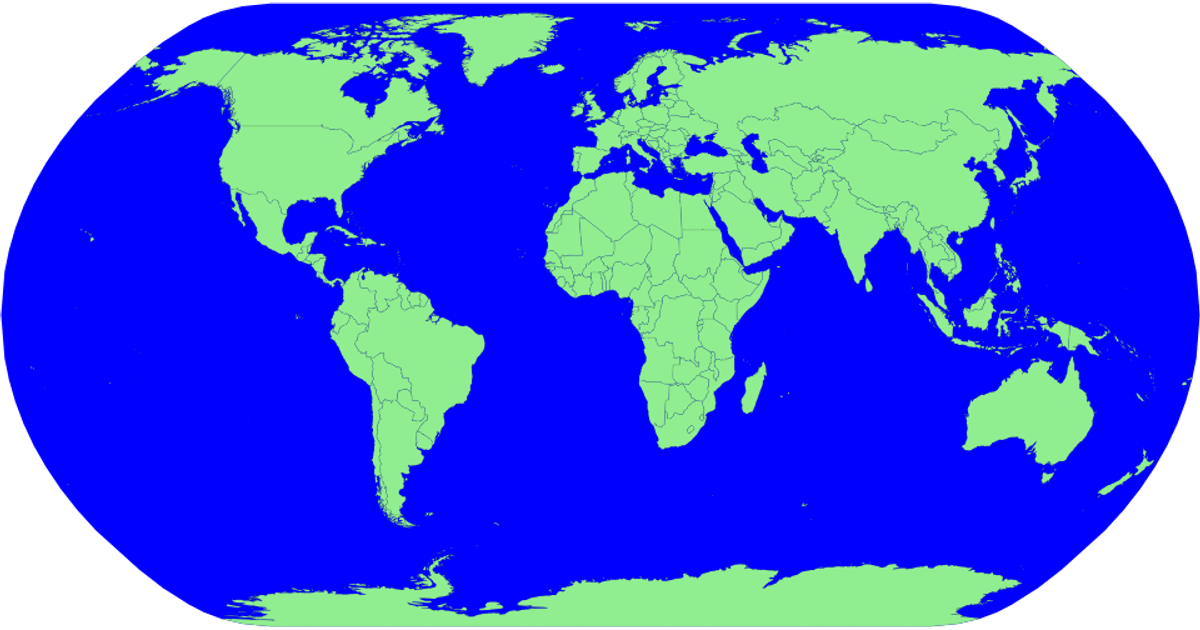
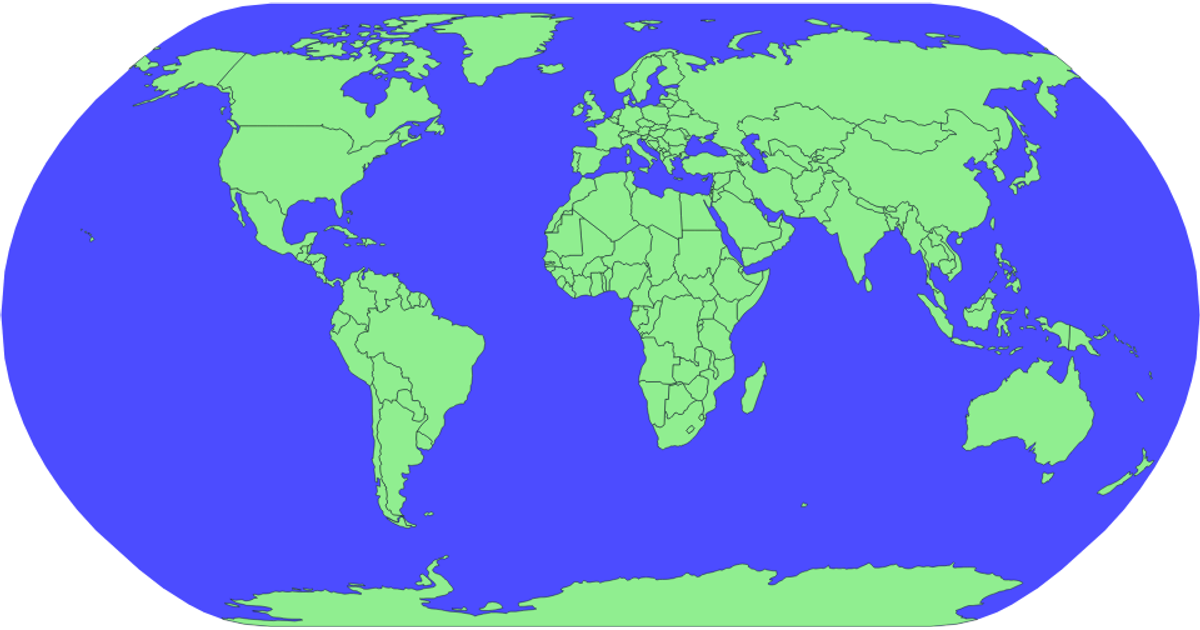
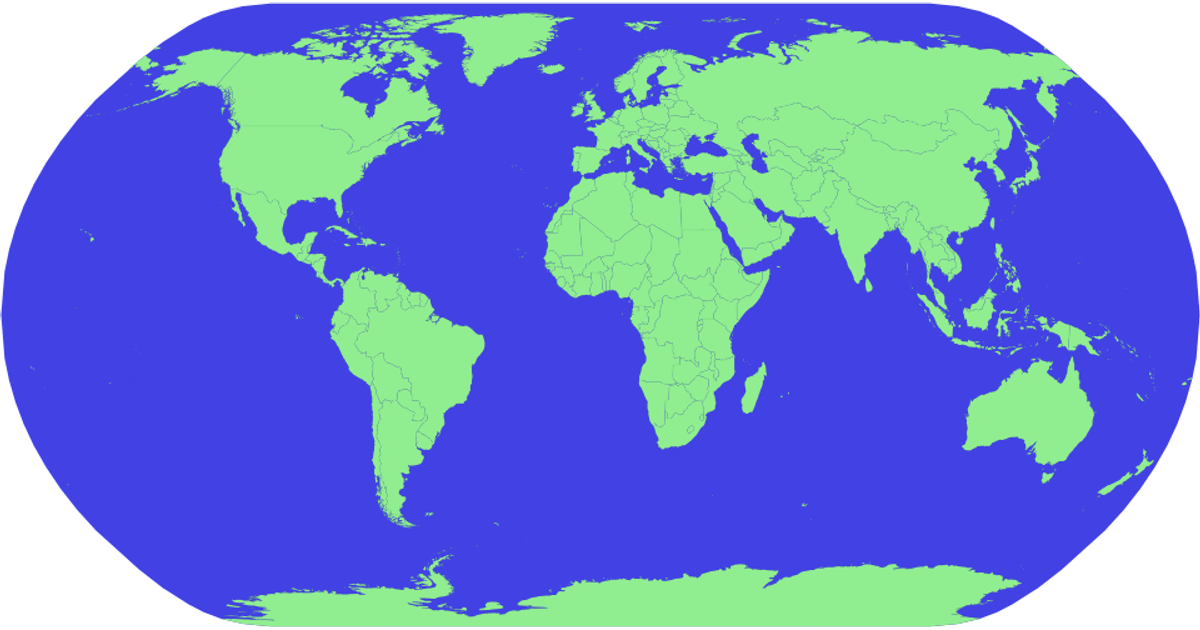
This visualization displays a world map with countries colored in green, where clicking a country selects it and updates a title showing its name. The map uses a natural Earth projection via `d3.geoNaturalEarth1` and `d3.geoPath` to render country boundaries from TopoJSON data loaded from the world-atlas package. Interactive zoom is implemented with `d3.zoom`, and selected countries are highlighted with a darker fill through SVG attributes. The rendering is SVG-based, with hover effects and titles per country provided by appended `<title>` elements.
AI-generated descriptionMIT Licensed



Comments
Sign in to join the discussion.