🌍 Public
world map
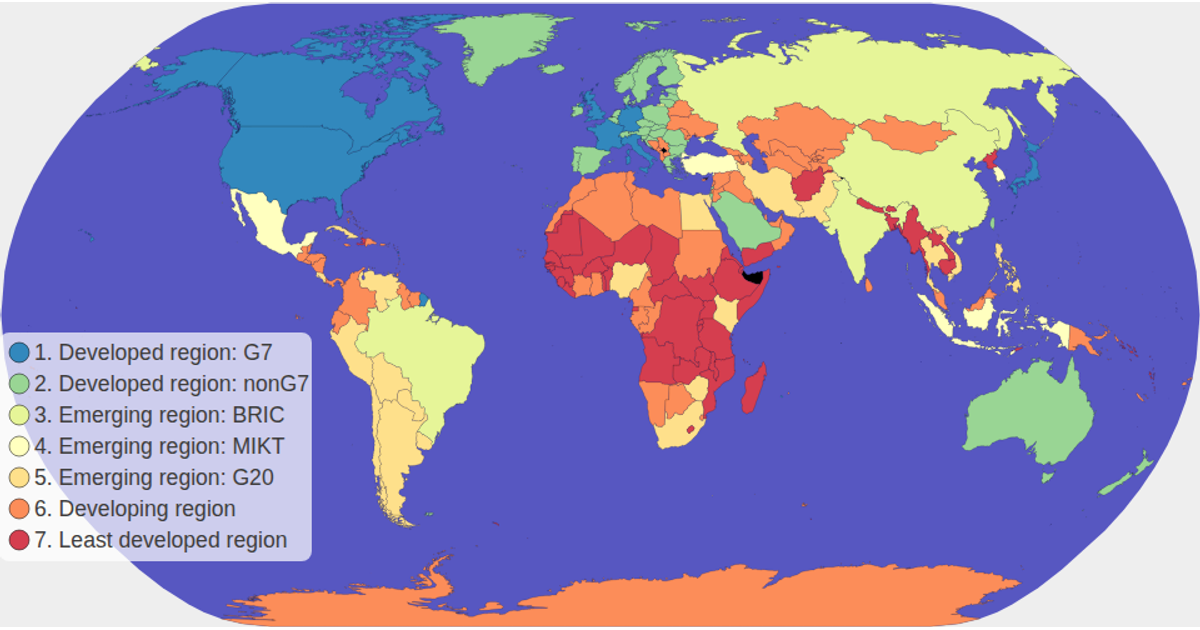
This example shows a choropleth world map colored by each country's economy classification, with a clickable color legend that filters and highlights matching countries while dimming others. The map uses d3.geoNaturalEarth1 and d3.geoPath to render TopoJSON world-atlas data, with d3.zoom enabling pan and zoom interactions. A d3.scaleOrdinal maps the spectral color scheme to the economy categories, and tooltips display country names and values. The SVG rendering includes CSS hover effects and opacity transitions for non-selected regions.
AI-generated descriptionMIT Licensed




Comments
Sign in to join the discussion.