🌍 Public
sriram scatter plot ice 7
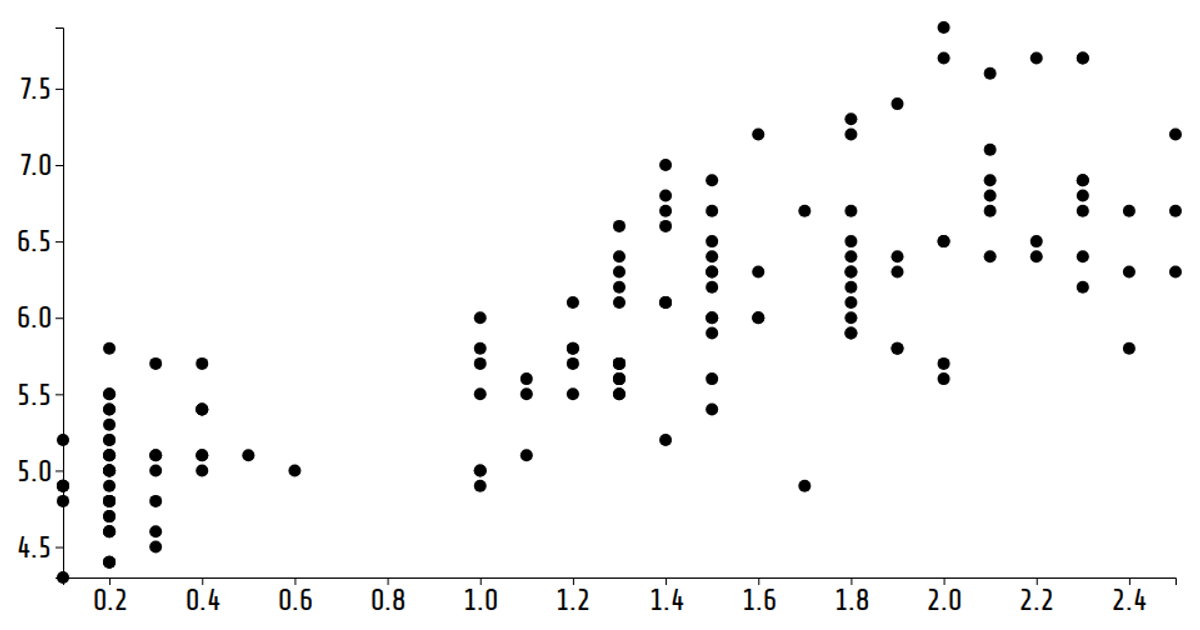
This D3.js scatter plot visualizes the Iris dataset, mapping sepal length on the y-axis and petal width on the x-axis. Different iris species are encoded using distinct symbols from D3’s `symbols` palette. The visualization uses `scaleLinear` and `scaleOrdinal` for positioning and symbol assignment, with axes generated via `axisLeft` and `axisBottom`. SVG rendering is fully responsive to the browser window, updating dimensions dynamically.
AI-generated descriptionA vanilla HTML implementation of a D3 scatter plot. Shows the Iris Dataset.
MIT Licensed


Comments
Sign in to join the discussion.