🌍 Public
Sri Ram ICE - 6 Scatter Plot
SSRI RAM REDDY KOTERU
Last edited Mar 6, 2022
Created on Mar 6, 2022
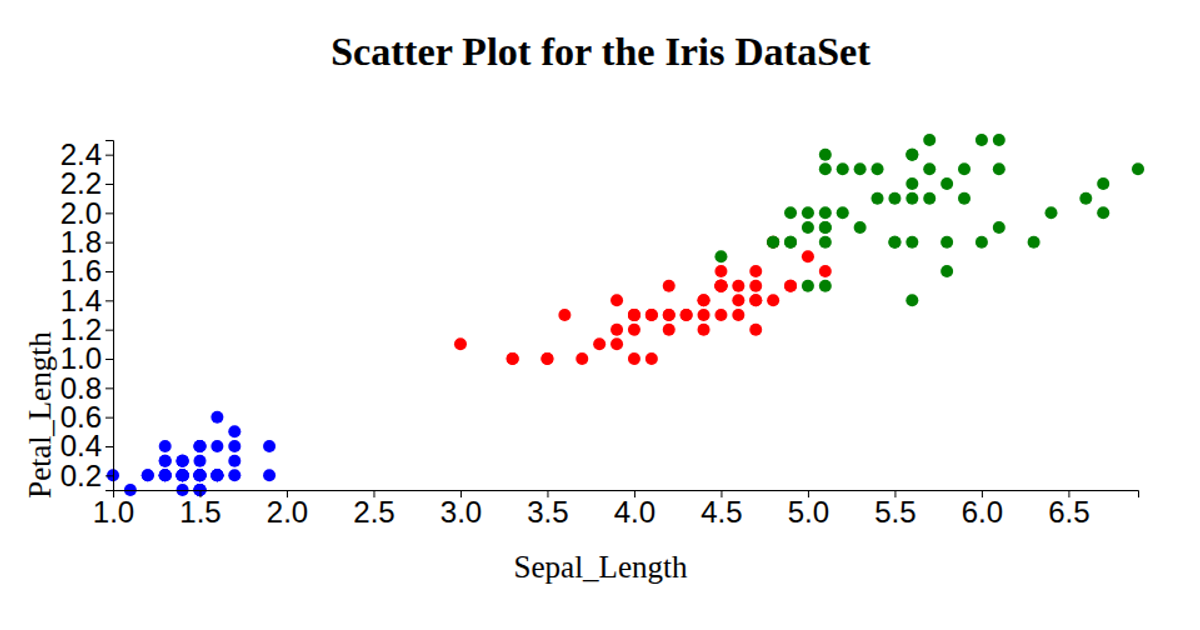
This scatter plot visualizes the Iris dataset, plotting petal length on the x-axis and petal width on the y-axis, with each point colored by species (setosa, versicolor, or virginica). The chart uses D3 v6’s `csv` loader to fetch the data and `scaleLinear` for axes, while SVG circles are positioned and sized via the `select` and `join` API techniques. Axis labels are added using `axisBottom` and `axisLeft`, and the code includes a custom marker function for categorical coloring.
AI-generated descriptionMIT Licensed





Comments
Sign in to join the discussion.