🌍 Public
Sriram ICE 7
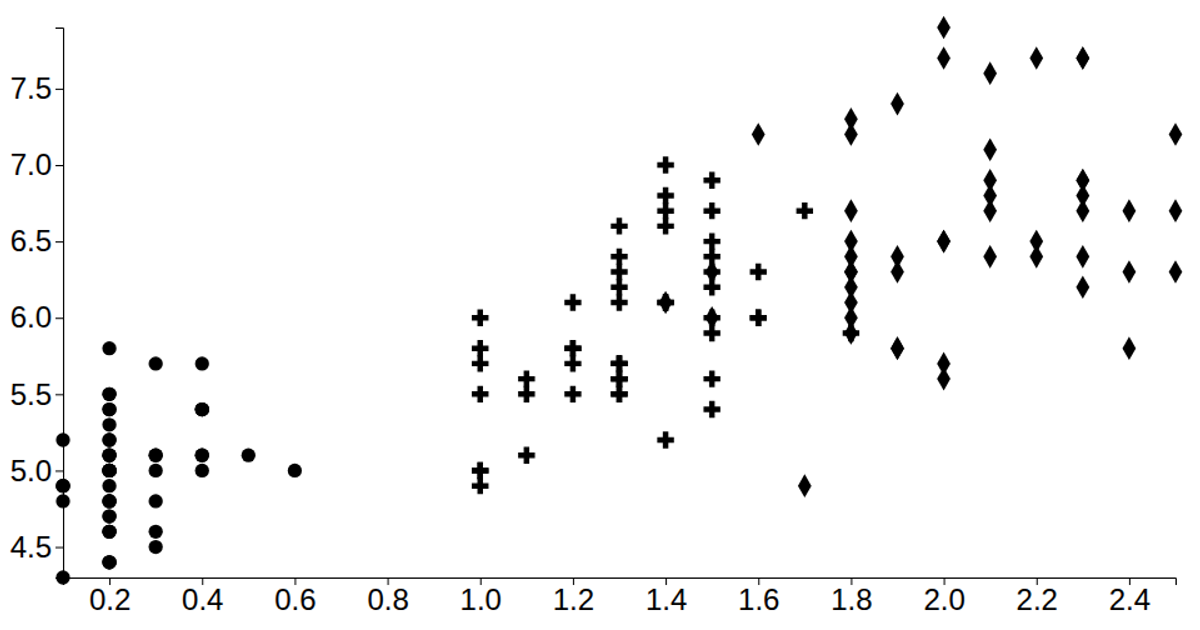
This interactive scatter plot visualizes the Iris dataset, displaying points with adjustable x-axis mappings that cycle through petal width, sepal width, petal length, and sepal length every second while the y-axis remains fixed on sepal length. Built with d3.js, the visualization uses scaleLinear, extent, axisLeft, axisBottom, and a reusable chart function pattern. The SVG animation transitions between different attribute combinations, with points rendered as circles and axes updating dynamically. The dataset is loaded from a GitHub Gist URL using d3.csv, and the plot resizes to fit the full browser window.
AI-generated descriptionA reusable scatter plot inspired by Towards Reusable Charts.
Shows the Iris Dataset.
MIT Licensed


Comments
Sign in to join the discussion.