🌍 Public
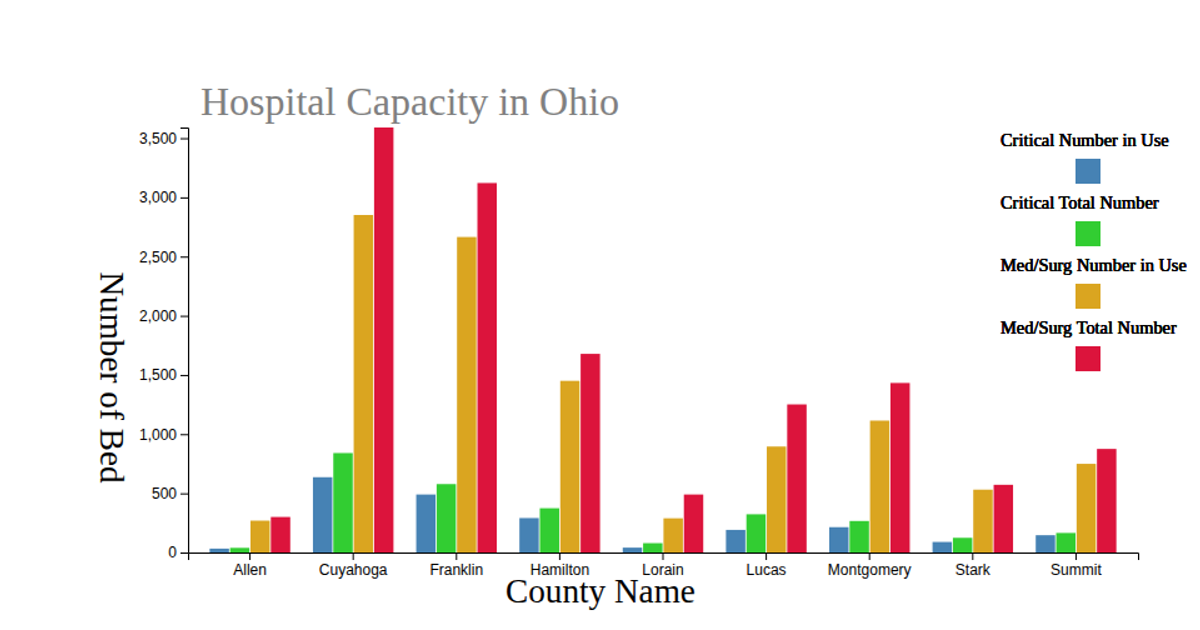
The comparasion of availiable hospital beds
This interactive donut chart compares available hospital beds across five Ohio regions, toggling between Critical Bed and Med/Surg Bed categories via radio buttons. Built with D3.js, it uses `d3.pie` and `d3.arc` to generate the arcs, with a legend of colored dots and labels. The visualization animates transitions between datasets using `transition.attrTween` and an arc interpolation function, while the SVG renders the chart and legend from a local JSON data source.
AI-generated descriptionThe comparasion of availiable hospital beds
MIT Licensed



Comments
Sign in to join the discussion.