🌍 Public
Stylized Bar Chart with Menus
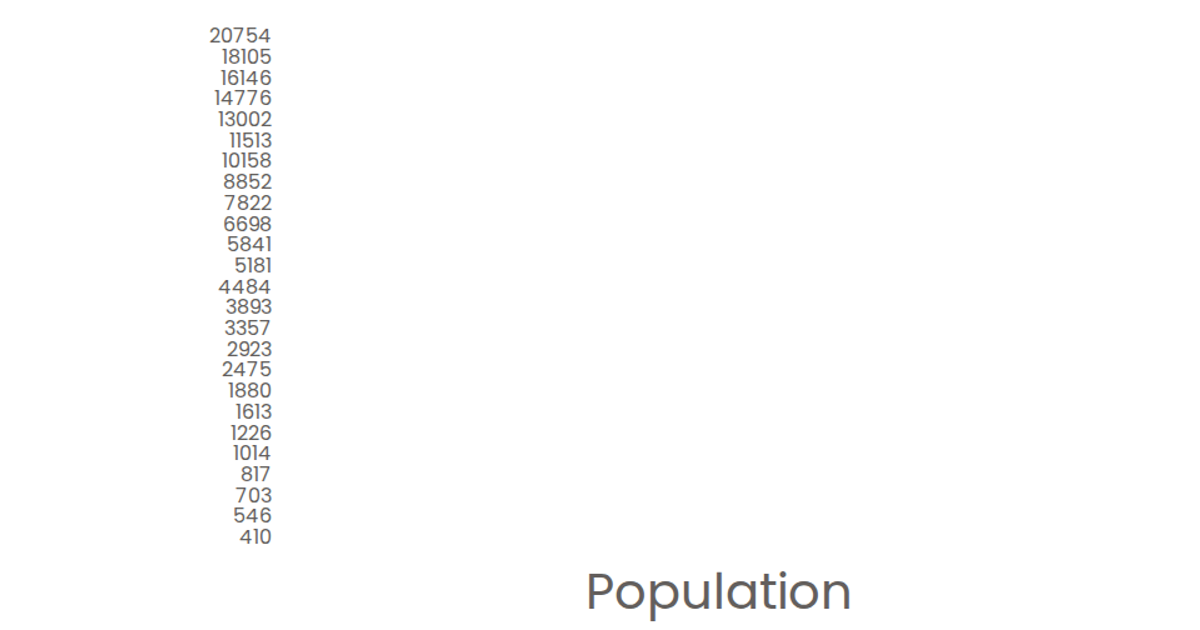
This example presents a stylized bar chart ranking the top 20 institutions by the number of vacant COVID beds, with interactive dropdown menus to switch between metrics such as total ICU beds, total COVID beds, and vacant COVID beds. Built with React and D3 v5, the visualization uses `scaleBand` for the categorical y-axis and `scaleLinear` for the numeric x-axis, rendering SVG bars that display tooltips on hover. The chart loads data from a CSV file via `d3.csv`, sorts it in descending order, and slices the top 20 entries. Styling employs the Poppins font and a custom color scheme for the marks and axes.
AI-generated descriptionA program that shows the top 10 most populous countries as a bar chart.
MIT Licensed



Comments
Sign in to join the discussion.