🌍 Public
Simple Data Visualization
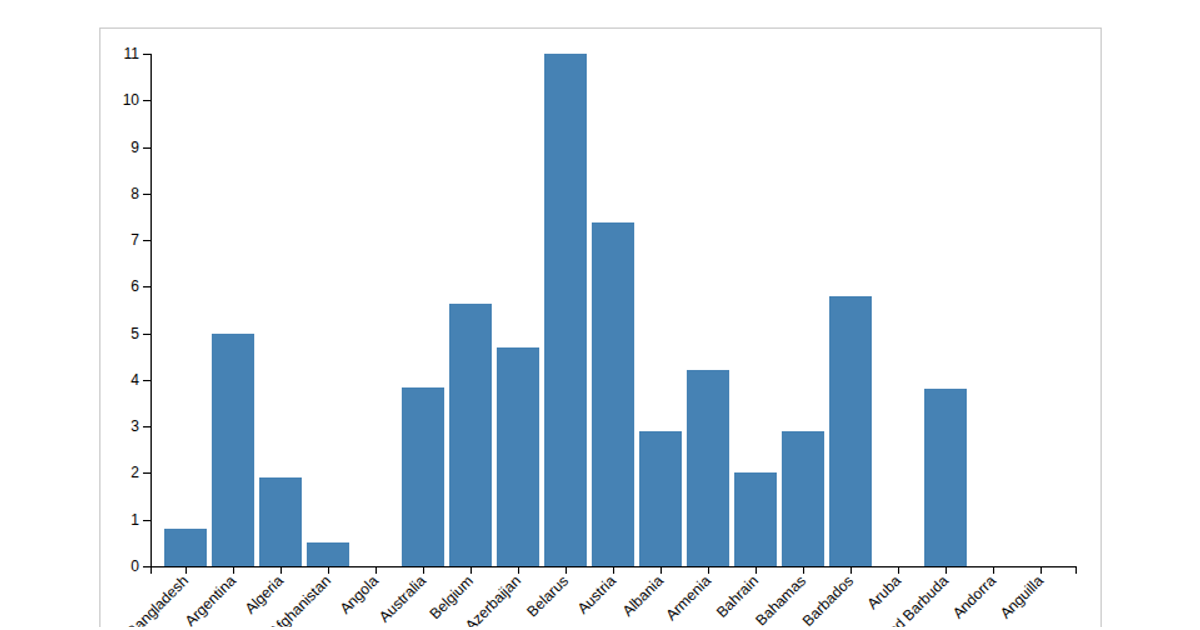
This example shows a bar chart of hospital beds per thousand people across countries, using a CSV dataset from a GitHub repository. The visualization renders in SVG with D3 v6, using `d3.scaleBand` for the x-axis and `d3.scaleLinear` with `d3.axisLeft` and `d3.axisBottom` for the axes. Interactive hover tooltips display the country name and bed count via mouse events and a `#tooltip` div. The chart includes styled bars that change color on hover, with rotated x-axis labels for readability.
AI-generated descriptionMIT Licensed


Comments
Sign in to join the discussion.