🌍 Public
Untitled
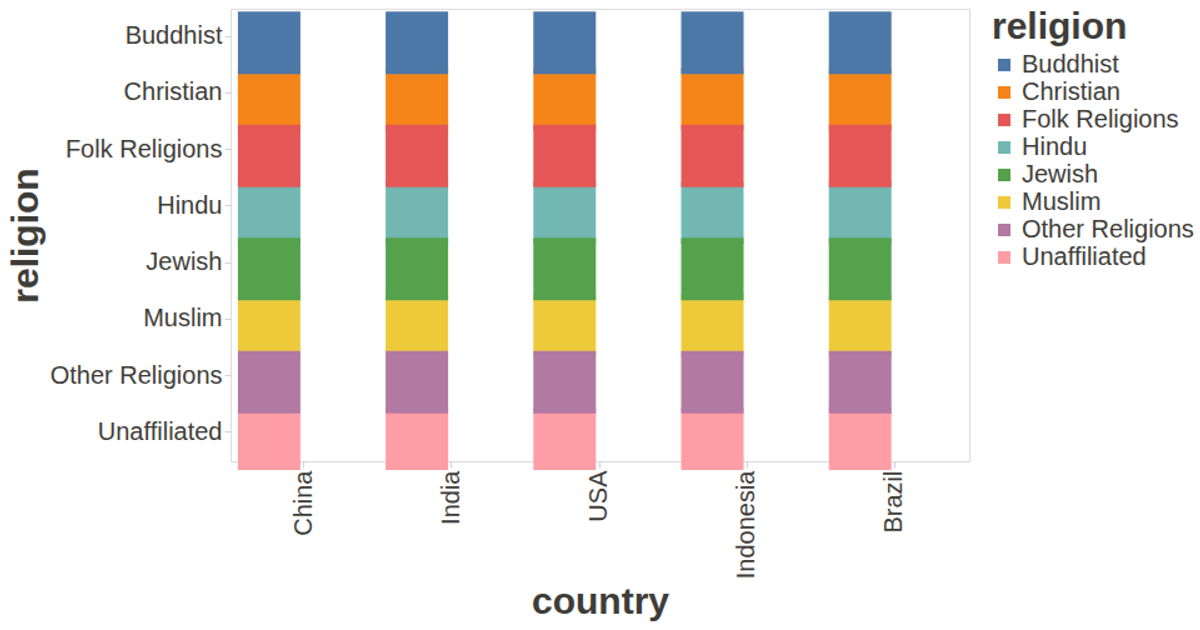
This bar chart displays the 2019 Economic Freedom Index, with countries ranked by population and colored by religion. The visualization is built using the Vega-Lite API, which constructs a bar mark with categorical country fields, quantitative population values, and religious categories for color encoding. Tooltips provide additional population details on hover. The data is fetched via d3.csv from a GitHub Gist, and the chart is rendered responsively using Vega-Lite’s autosize fit setting, with custom axis and label styling from the provided configuration.
AI-generated descriptionMIT Licensed



Comments
Sign in to join the discussion.