🌍 Public
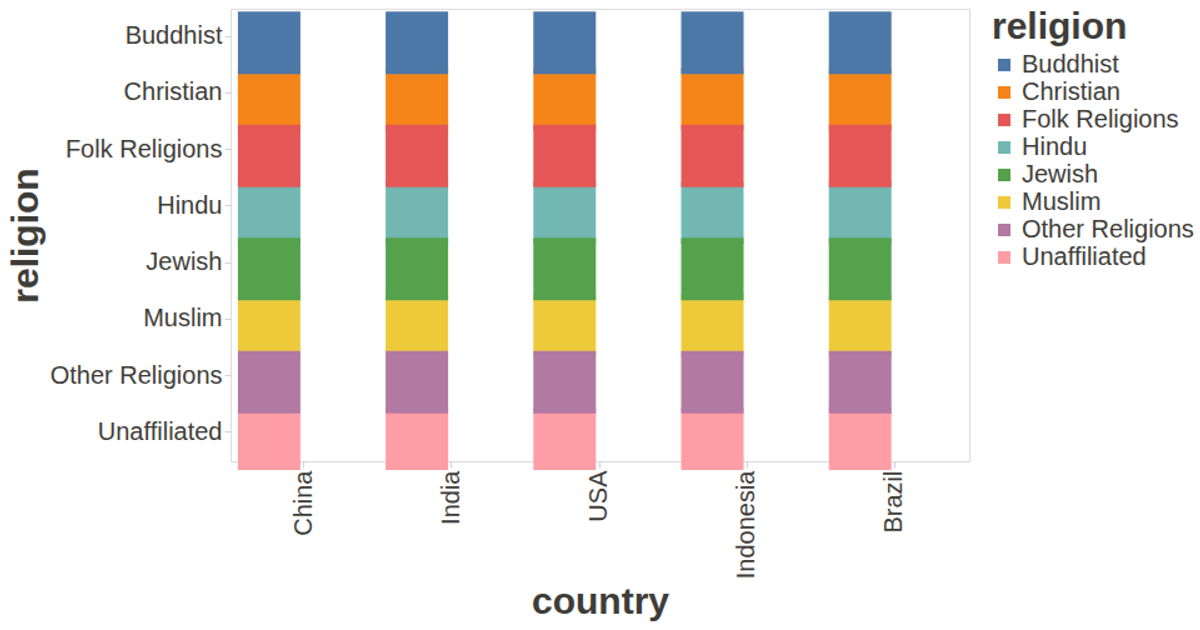
Data visualization of population of religion in country with respect to country
This visualization displays the population of different religions across countries using a bar chart. Each bar’s position encodes the country and religion, while its color represents the population value, with tooltips revealing exact numbers. The visualization is built with Vega-Lite and the vega-lite-api, fetching data from a CSV via d3.csv. It uses customized axis and label styling from a config object, rendering full-screen with fit autosizing.
AI-generated descriptionData visualization population by religion with respect to their country
MIT Licensed




Comments
Sign in to join the discussion.