🌍 Public
Untitled
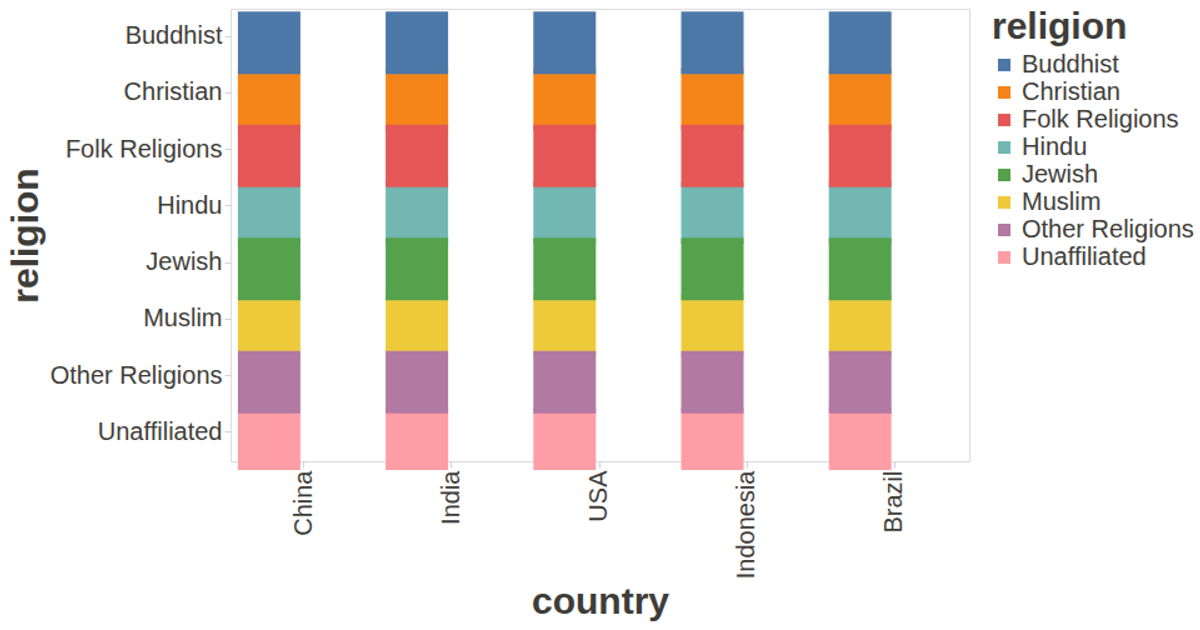
This example visualizes the population of countries by religion, with bars sized by population and colored by religion. The data comes from a CSV file of religion by country, fetched using D3’s `csv` method. Built with the `vega-lite-api`, it uses a bar mark, encodes country on the x-axis, population on the y-axis, and religion for color, sorting by population in descending order. The visualization is rendered as an SVG and includes custom axis styling for readability.
AI-generated descriptionA visualization constructed using the vega-lite-api.
The data shown here comes from the UCI Machine Learning Repository: Auto MPG Data Set, via Gist: Scatter Plot with Menus.
MIT Licensed




Comments
Sign in to join the discussion.