🌍 Public
q1
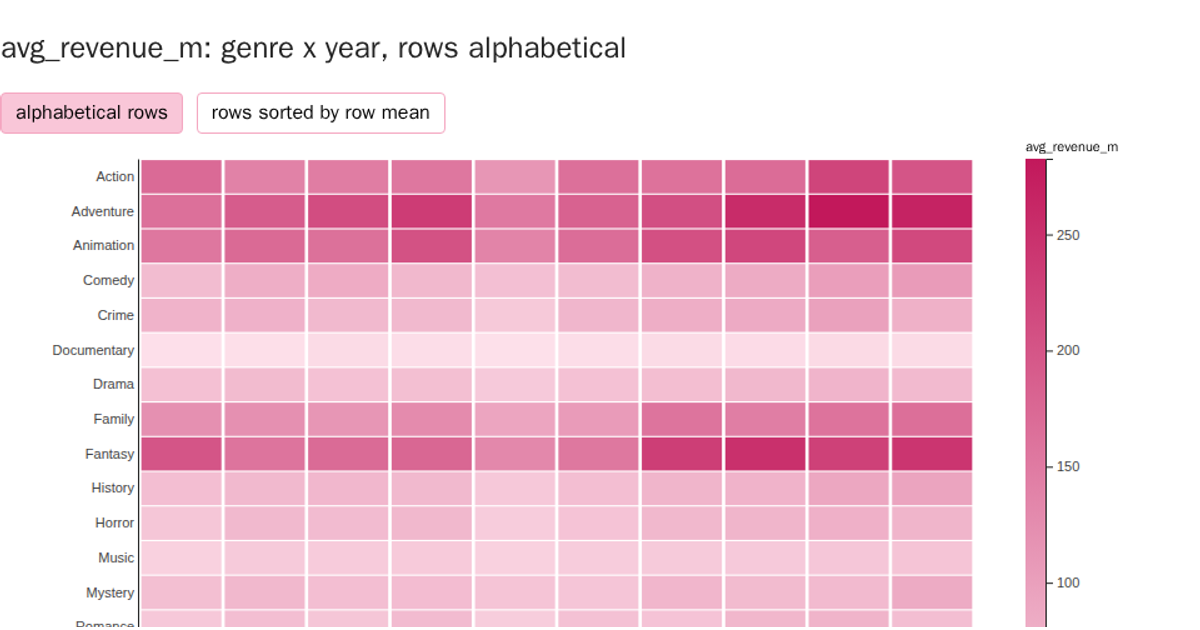
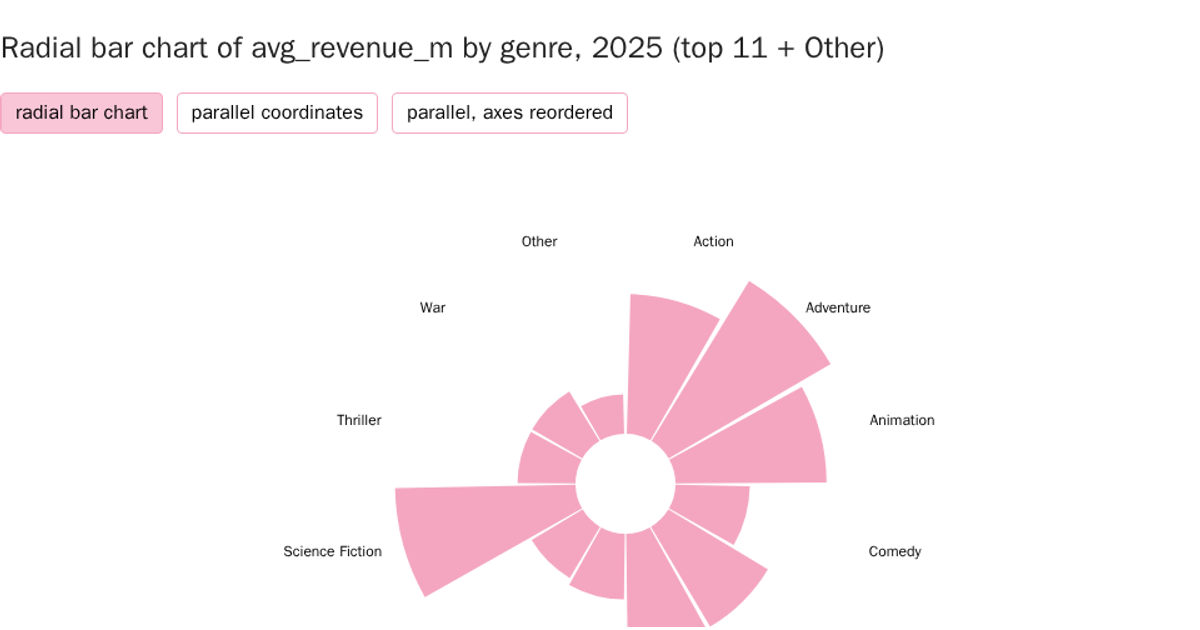
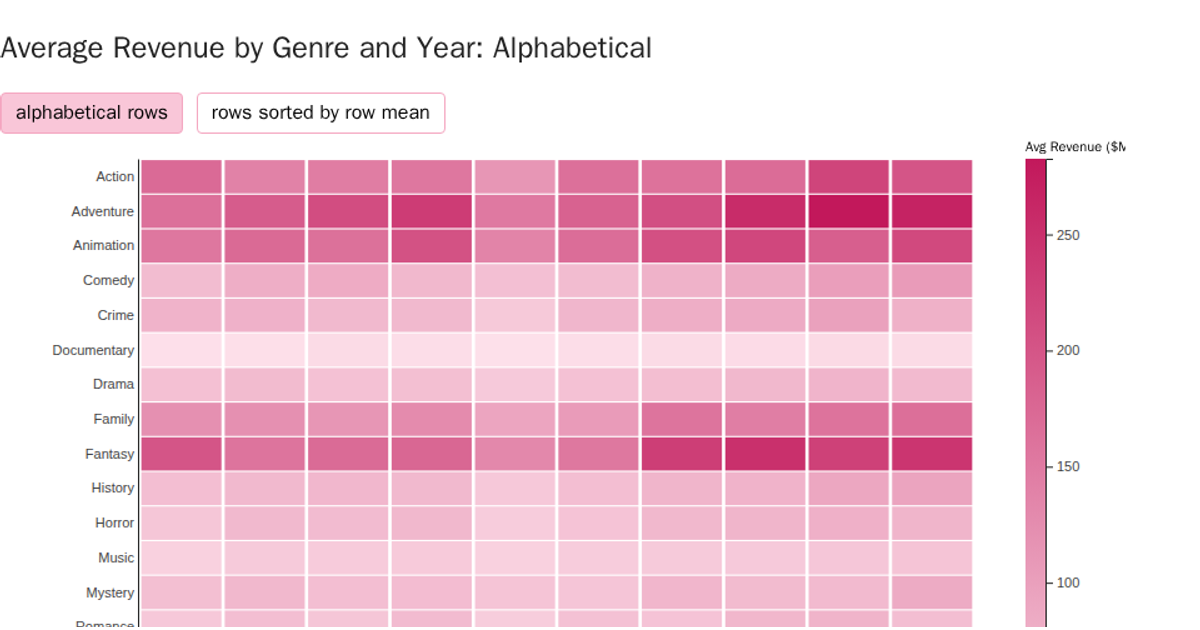
This interactive bar chart explores movie genres, average revenue, and movie counts across years, with data loaded from a CSV file. The visualization offers five views: alphabetical, by value, by derived metric, stacked, and grouped arrangements. Using D3 v7, the chart employs `d3.scaleBand`, `d3.scaleLinear`, and `d3.scaleOrdinal` with an interpolated color range to distinguish years. The SVG output responds to button clicks that trigger `drawBars` or `drawTwoKeys` functions, dynamically re-sorting and re-rendering the bars. The stacked and grouped modes use `d3.sum` and a shared x-axis for genre and year comparisons.
AI-generated descriptionMIT Licensed



Comments
Sign in to join the discussion.