🌍 Public
q3
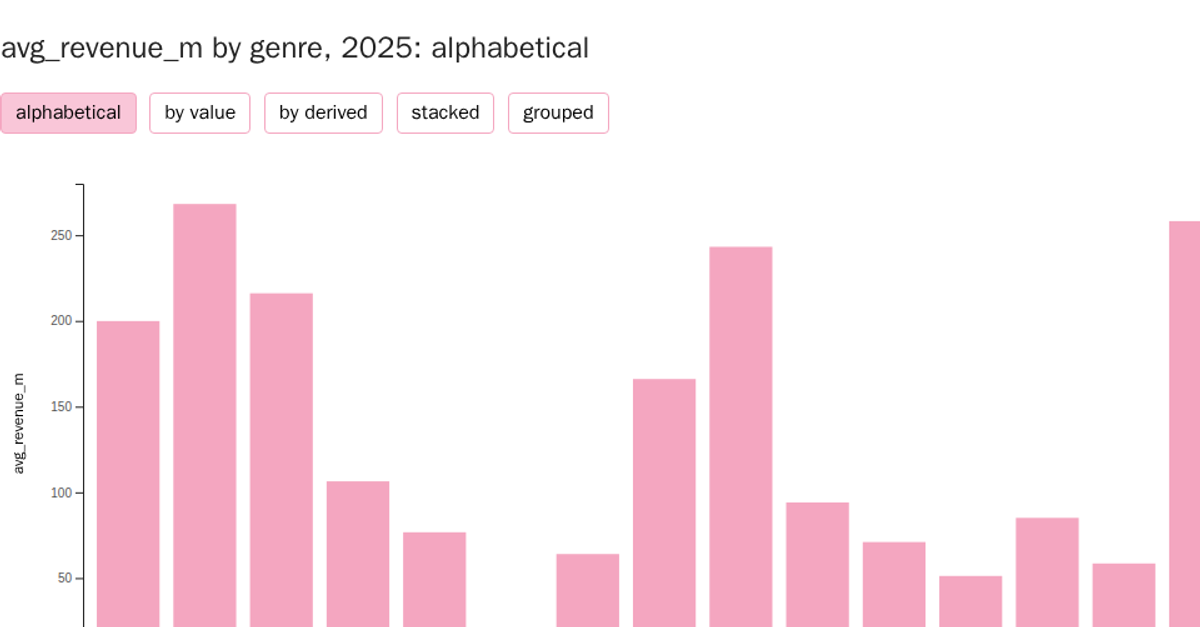
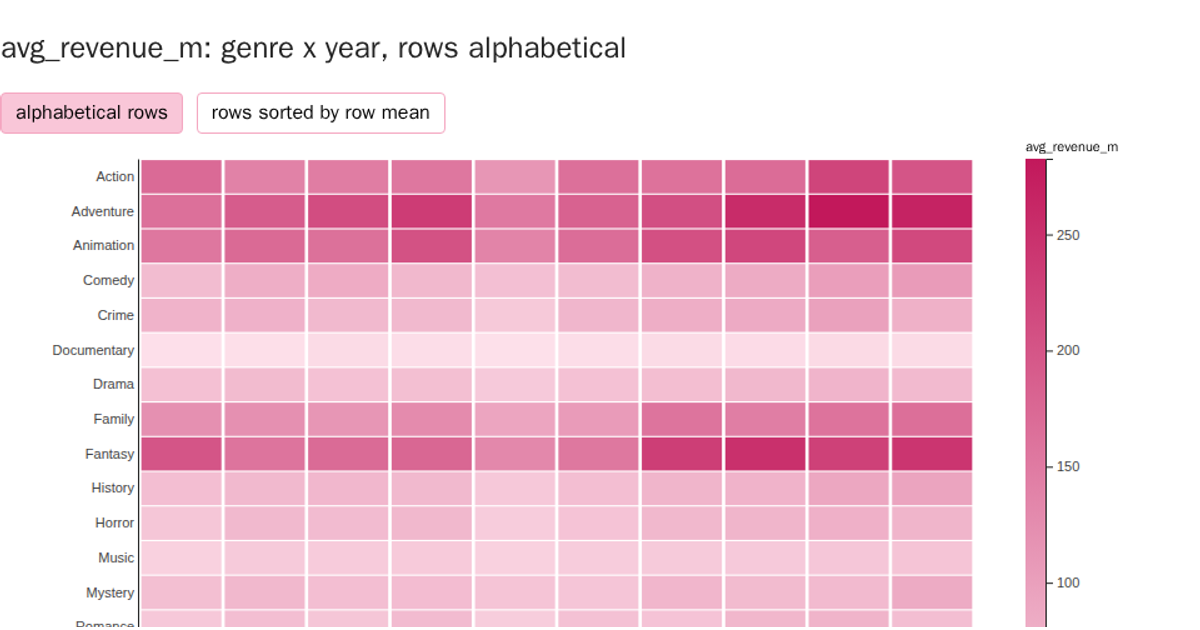
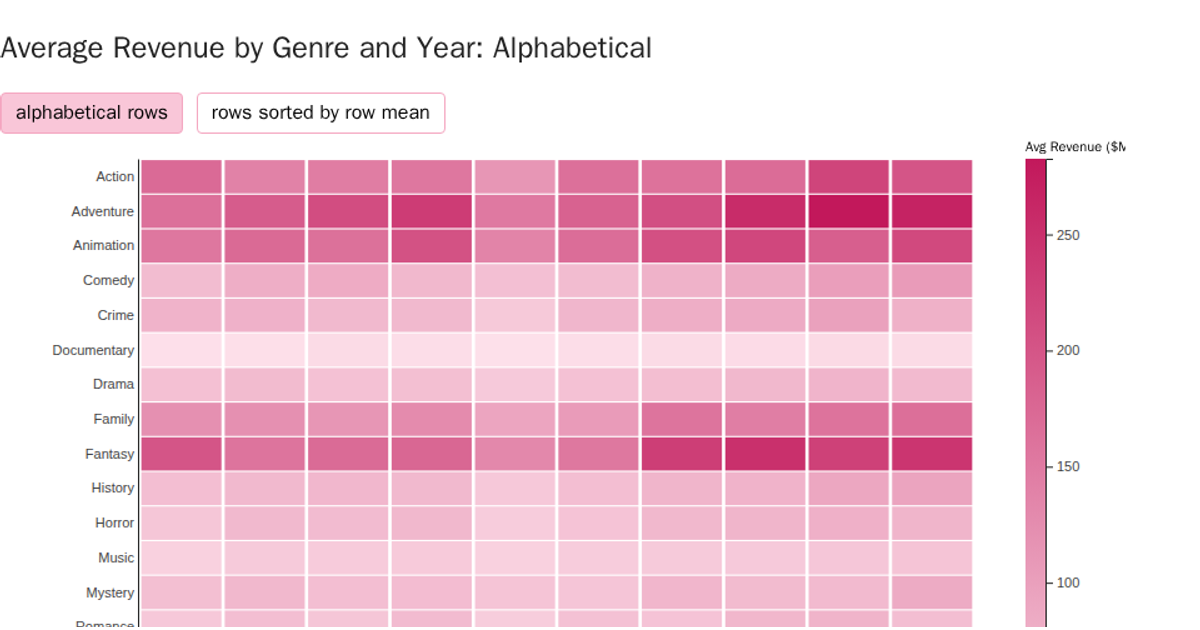
This visualization presents movie data from a CSV file using two complementary chart types. The radial bar chart displays average revenue by genre, sorting values descending while grouping remaining categories as "Other." The parallel coordinates chart shows five numeric dimensions—rating, runtime, budget, revenue, and popularity—with individual movies as polylines colored by year using d3.scaleOrdinal and d3.interpolateRgb. Users toggle between views via buttons, with the parallel chart also supporting reordered axes through d3.scalePoint, while all rendering relies on SVG paths and d3.arc.
AI-generated descriptionMIT Licensed

Comments
Sign in to join the discussion.