🌍 Public
Q3
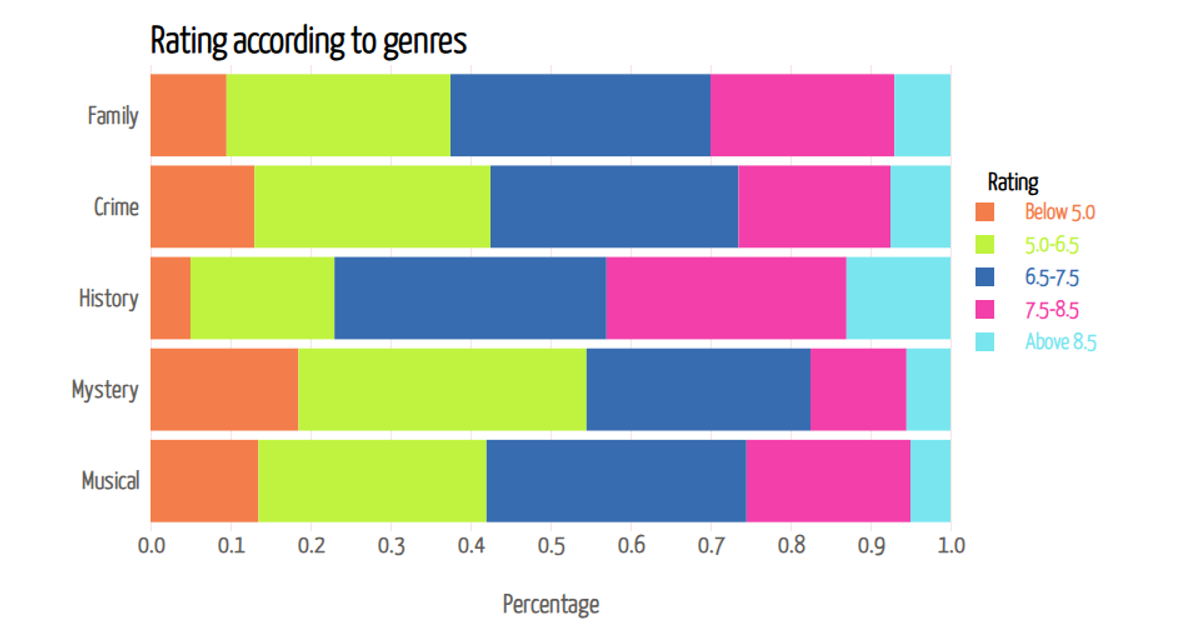
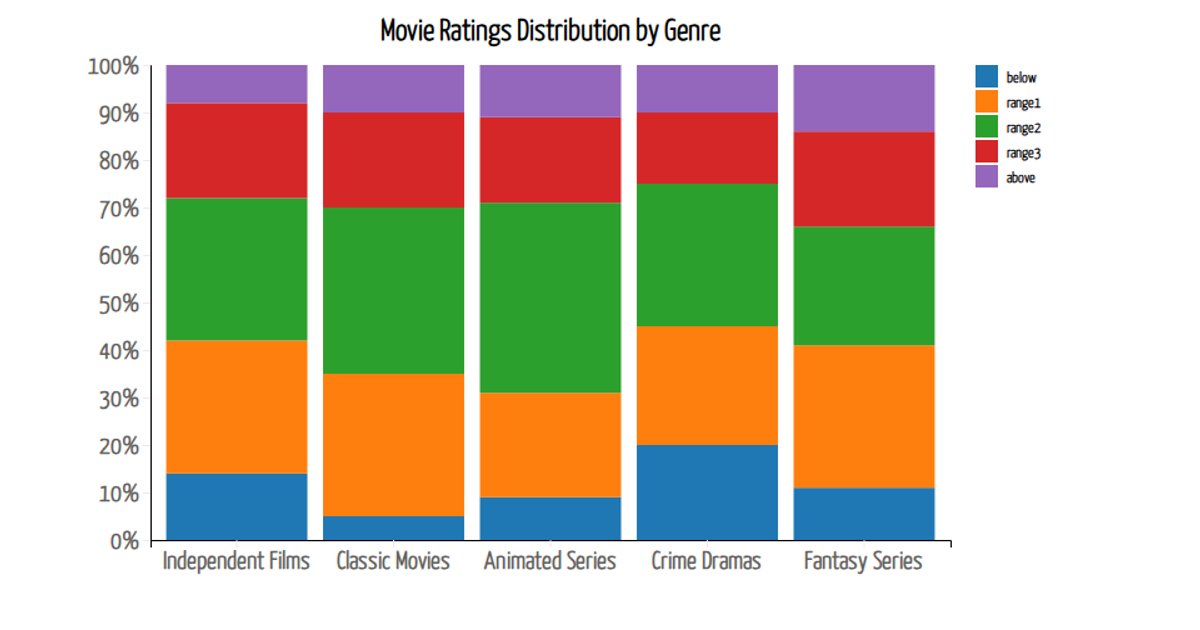
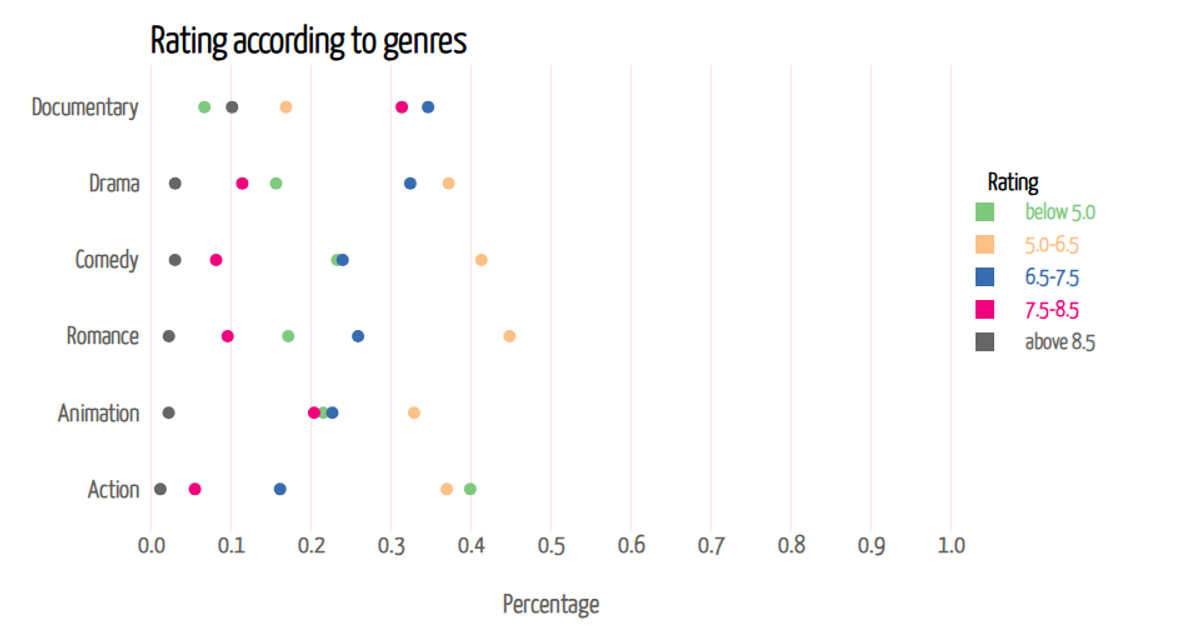
This bar chart displays the relationship between movie ratings and awards won or nominated, using data from the UN. The visualization plots each movie as a circle, with a linear scale for awards and a band scale for ratings. Built with D3 v5, the code uses `scaleLinear`, `scaleBand`, `axisLeft`, and `axisBottom` to render the SVG chart. The data is loaded from a CSV file, and the circle size reflects the band scale's bandwidth.
AI-generated descriptionThis bar chart...UN.
MIT Licensed





Comments
Sign in to join the discussion.