Skip to main content
Explore
Solutions
Services
Pricing
Quick Start
Demo
Start free
Log in
Send feedback
✕
Tell us what works and what could be better. We read every submission.
Send feedback
✕
Tell us what works and what could be better. We read every submission.
M
Maciek Sitkowski
@sitek94
·
32 public vizzes
Fork of Coronavirus Deaths by Country over Time (with Voronoi Hover)
Oct 23, 2021
Fork of Coronavirus Linear Y Axis
Oct 2, 2021
Cheap Tricks for Interaction
Dec 20, 2020
React Starter
Dec 17, 2020
Sized Points on a Map
Oct 2, 2020
Untitled
Oct 2, 2020
React Starter
Sep 24, 2020
Axes with React and D3
Sep 23, 2020
The Margin Convention
Sep 23, 2020
Very Simple Bar Chart with React and D3
Sep 23, 2020
Rendering Data with React and D3
Sep 23, 2020
Rendering Data with React
Sep 23, 2020
Loading Data with D3 and React
Sep 23, 2020
Parse and process CSV data
Sep 23, 2020
Interaction with React
Sep 23, 2020
D3 with React first steps
Sep 22, 2020
Color Legend - Swatches
Sep 21, 2020
World Countries Tree
Sep 17, 2020
Legend experimenting
Sep 4, 2020
Color and size legends
Sep 3, 2020
Bowl of fruit - Nested version of general update
Sep 3, 2020
Blank Canvas
Sep 2, 2020
Interactive Map with d3.js
Sep 2, 2020
Let's make a map with D3.js!
Sep 2, 2020
Bowl of fruit - Hovering
Sep 2, 2020
Bowl of fruit - Click to select
Sep 2, 2020
Bowl of fruit - general update pattern
Sep 2, 2020
Cars Scatter Plot
Sep 2, 2020
Cars Scatter Plot
Sep 1, 2020
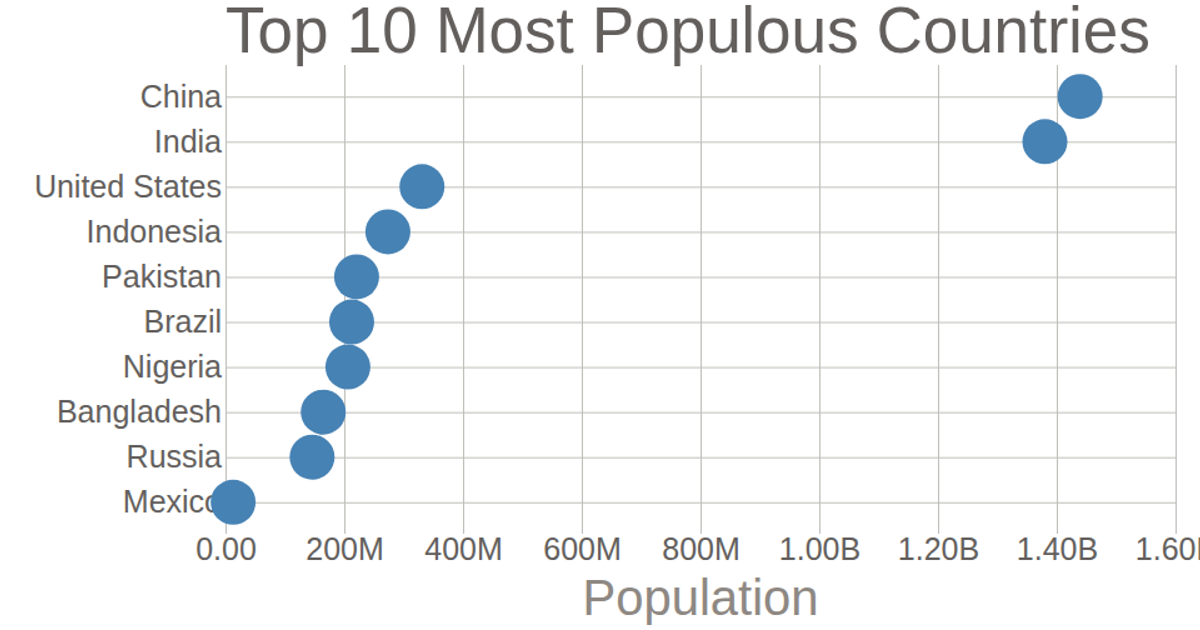
Top 10 Most Populous Countries Scatter Plot
Sep 1, 2020
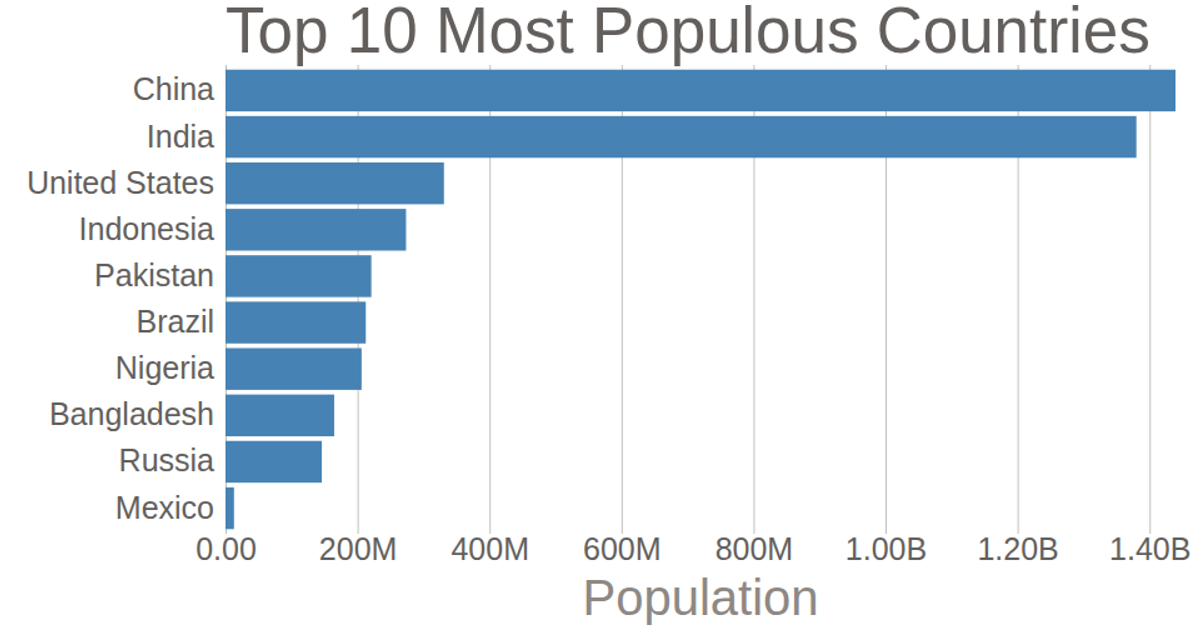
Top 10 Most Populous Countries Bar Chart
Sep 1, 2020
Making a bar chart
Aug 27, 2020