0 views in last 90 days
princit
@princit
Public vizzes

coronavirus countries Map
Focus + Context
Visualization 2 (Multiline graph)

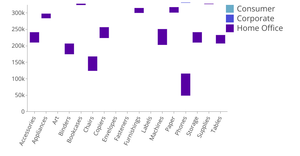
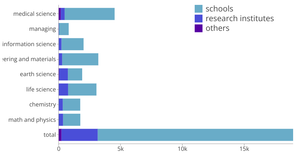
Visualization 1 (Stacked Bars)

ILINet Flu Surveillance Data Interactive Visualization
Visualization 1 (Stacked Bars)

Tab.1(3)- Items of general project funding in 2018 (by nature of institutions)

Tab.1(3)- Items of general project funding in 2018 (by nature of institutions)

Tab.1(3)- Items of general project funding in 2018 (by nature of institutions)

Covid-19

ILINet Flu Surveillance Data Interactive Visualization
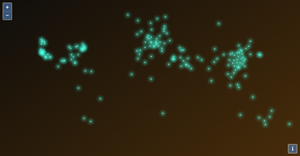
Firefly Map of Coronavirus Case Locations
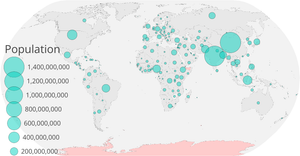
Circles on a Map

D3 v5 Zoomable Sunburst
Untitled

Untitled

Untitled
MULTILINE CHART

MULTILINE CHART

MULTILINE MELTED
MULTILINE MELTED
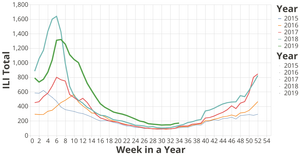
ILINet Flu Surveillance Data
D3 Example
D3 Example

MULTILINE CHART
Tab.1(3)- Items of general project funding in 2018 (by nature of institutions)
Tab.1(3)- Items of general project funding in 2018 (by nature of institutions)

Tab.1(3)- Items of general project funding in 2018 (by nature of institutions)

Tab.1(3)- Items of general project funding in 2018 (by nature of institutions)
MULTILINE CHART

MULTILINE MELTED

ILINet Flu Surveillance Data

Selecting a year on a line chart

Tab.1(3)- Items of general project funding in 2018 (by nature of institutions)

Tab.1(3)- Items of general project funding in 2018 (by nature of institutions)

Tab.1(3)- Items of general project funding in 2018 (by nature of institutions)

Tab.1(3)- Items of general project funding in 2018 (by nature of institutions)
MULTILINE MOOD
MULTILINE CHART
Graph with four lines
Tab.1(3)- Items of general project funding in 2018 (by nature of institutions)

Tab.1(3)- Items of general project funding in 2018 (by nature of institutions)

Tab.1(3)- Items of general project funding in 2018 (by nature of institutions)
Tab.1(3)-Amount of general project funding in 2018 (by nature of institutions)
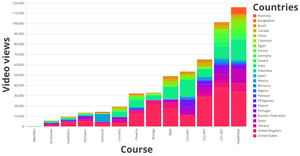
EdX Viewer Data by Course with Stacked Bars, AY2013
Tab.1(3)- Items of general project funding in 2018 (by nature of institutions)

D3 Example
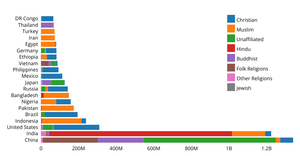
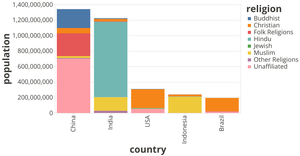
Religions of Largest 20 Countries
Customizing Axis
Line chart with multiple lines

MULTILINE MELTED
Line Chart with Multiple Lines

D3 Example
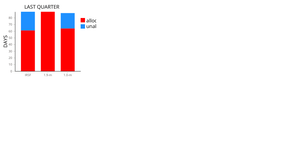
Stacked Bars

Age Distribution Chart

Stacked Bars

Stacked Bars

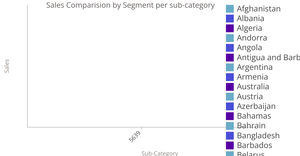
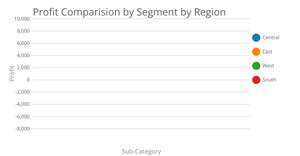
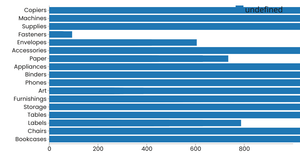
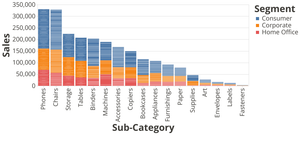
Sales comparision by segment per sub-category
Stacked Bars
Vega-Lite API Template

Vega-Lite API Template

Melting Data for multiple lines
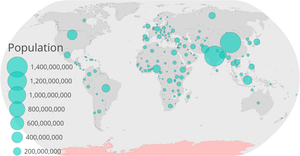
Circles on the Map
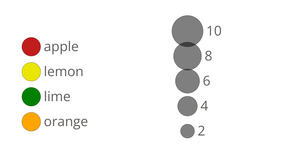
Color and Size Legends

Circles on the Map

Scatter plot with menus

Choropleth Map with interactive filtering
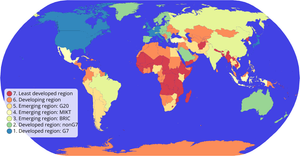
Choropleth Map

Choropleth Map

Choropleth Map
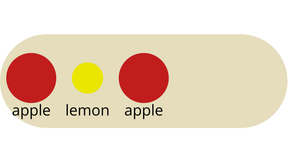
Bowl of Fruit - General Update Pattern

Color and Size Legends

World Countries Tree

Blank Canvas
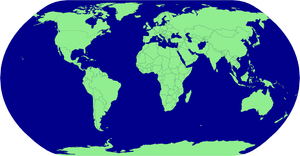
Lets Make a map with D3.js

Bowl of Fruit -Hover to select

Bowl of Fruit -Click to select
Bowl of Fruit - General Update Pattern

Bowl of Fruit-General Update Pattern

Bowl of Fruit-General Update Pattern

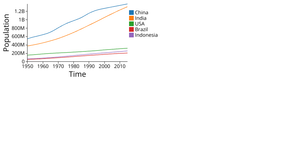
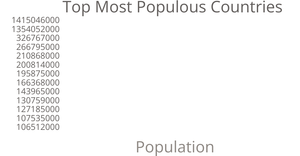
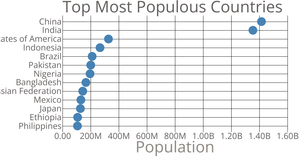
World Population Area Chart

Temprature in San Francisco Line Chart

Temprature in San Francisco Line Chart

Temprature in San Francisco Scatter plot

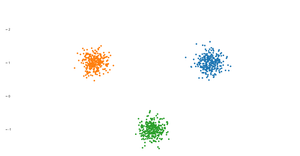
Scatter plot
Scatter plot
Learn D3.js
Learn D3.js

Learn D3.js
Making a Bar Chart

Lets Make a face with D3.js