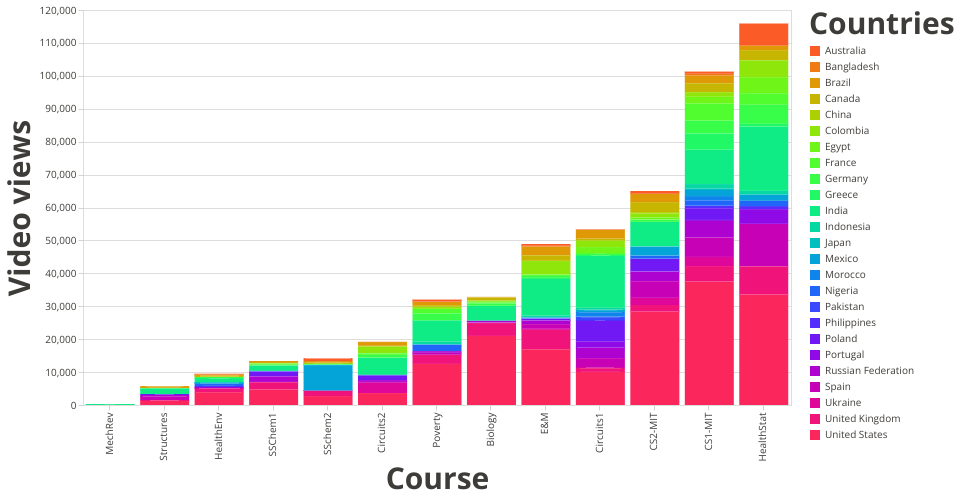
A visualization of video views according to HarvardX or MITX course on EdX for the 2013 academic year. These are the number of view counts per viewer. The color in the stacked bars reflect the countries from which the view events emanated.
The visualization was constructed using the vega-lite-api and the data can be found on the MITx-HarvardX Dataverse
MIT Licensed