Skip to main content
Explore
Solutions
Services
Pricing
Quick Start
Demo
Start free
Log in
Send feedback
✕
Tell us what works and what could be better. We read every submission.
Send feedback
✕
Tell us what works and what could be better. We read every submission.
P
prachow
@prachow
·
24 public vizzes
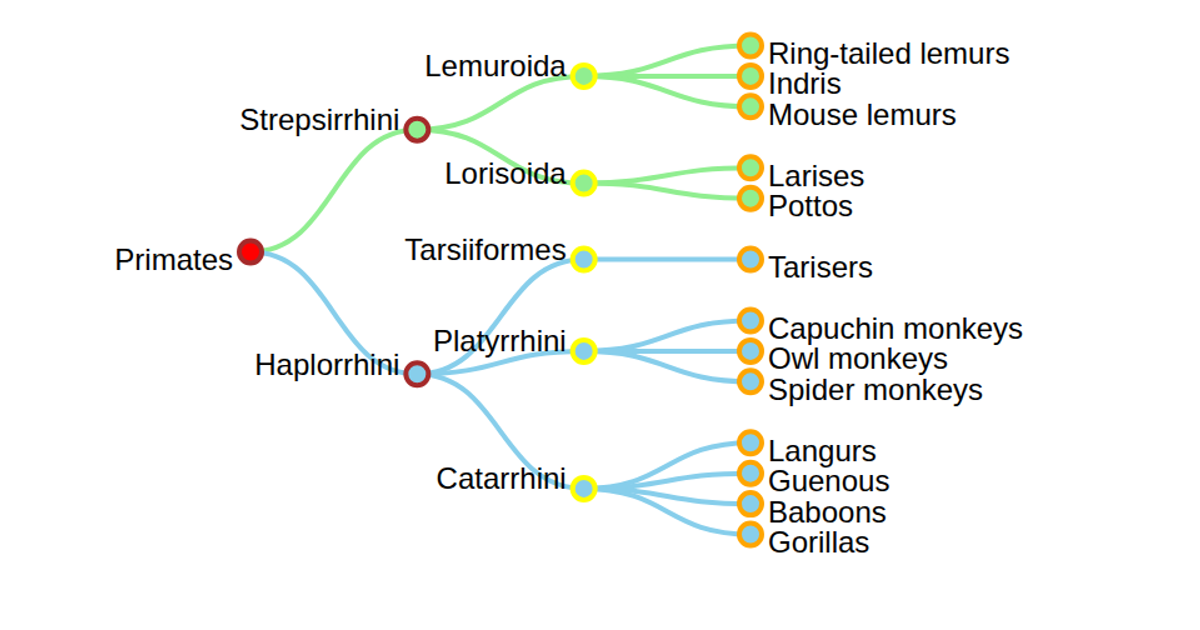
Tree chart for monkey species
Mar 29, 2023
Fork of visualizing the Africa map
Mar 28, 2023
My Social Network Visualization
Mar 27, 2023
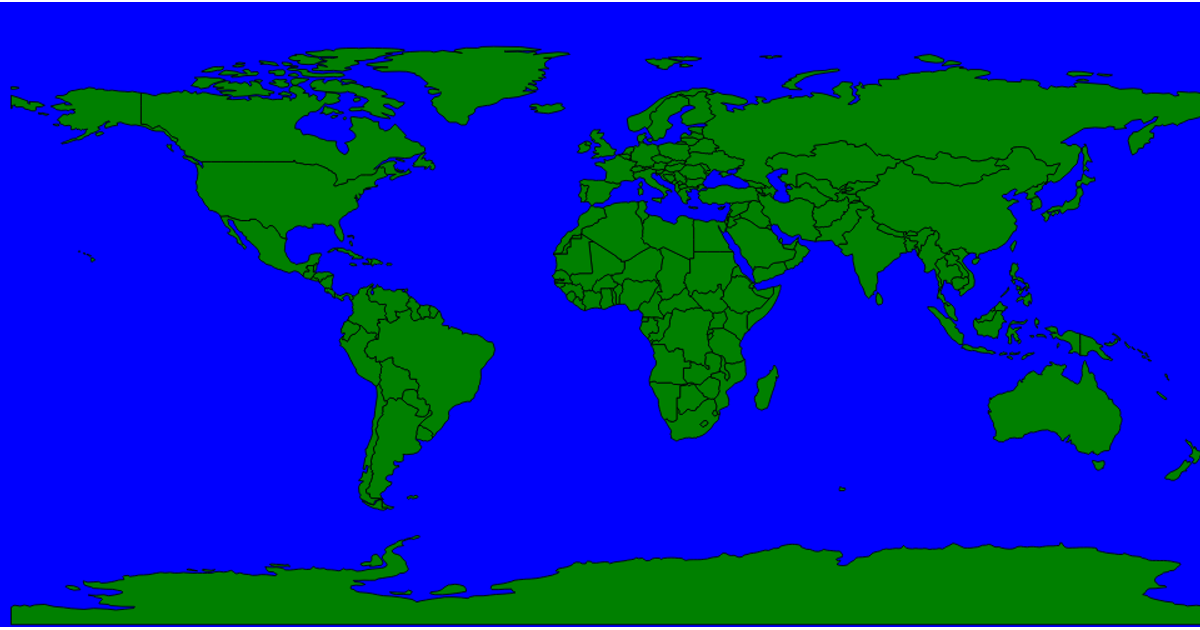
Fork of visualizing the world map
Mar 27, 2023
Fork of ICE-6: Rendering Marks and Channels with React & D3
Mar 19, 2023
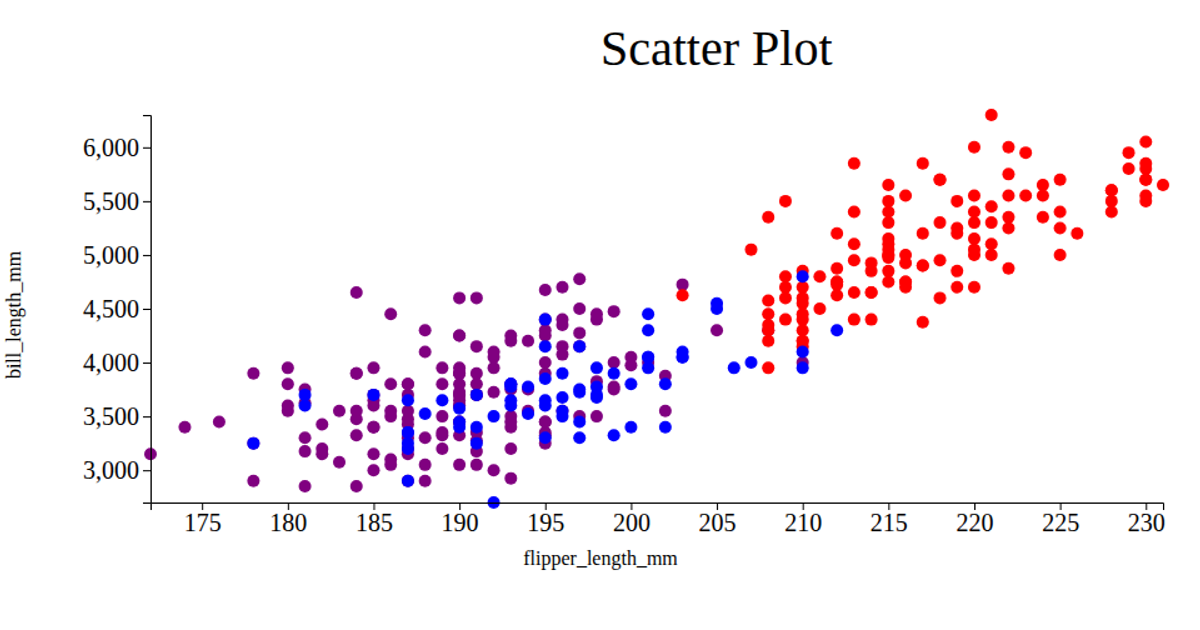
Reusable scatter plot with different symbols
Mar 13, 2023
Fork of DV ICE7- Area Graph
Mar 13, 2023
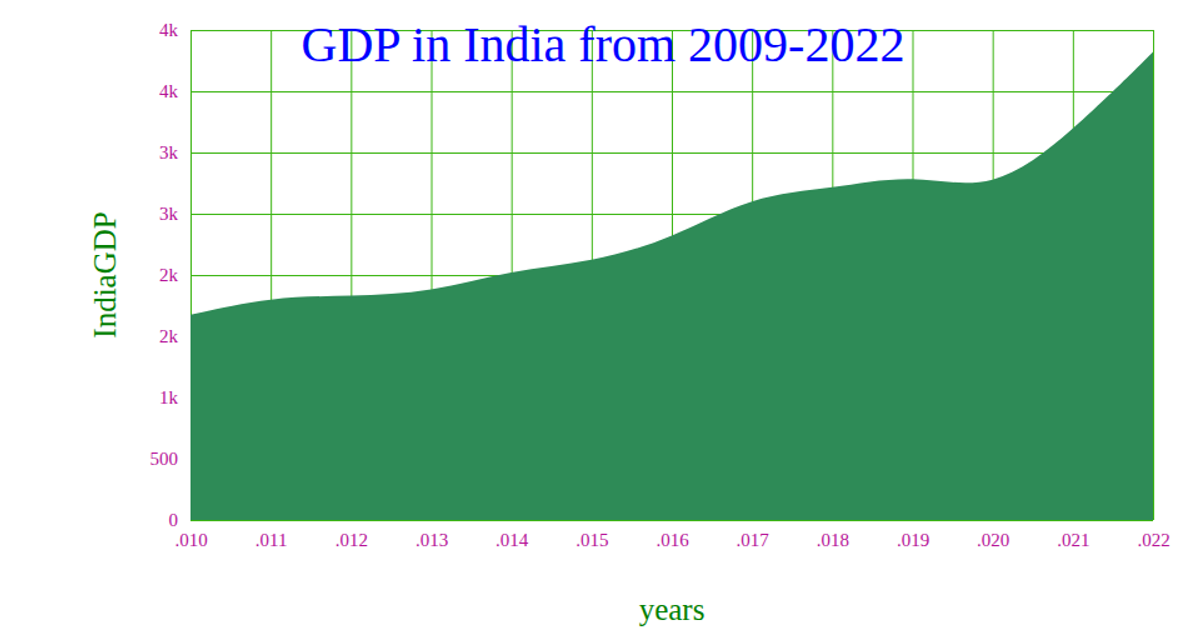
IndiaGDP of Area Chart
Mar 13, 2023
Fork of ICE-7 Fork of Area Chart
Mar 13, 2023
Fork of ICE7_Area_chart
Mar 13, 2023
IndiaGDP from 2009 to 2022 Line Chart
Mar 13, 2023
Literacy rate of visualization in Pie Chart
Mar 13, 2023
Fork of Fork of ICE 7 Area Chart
Mar 12, 2023
GDP rate in Line Chart
Mar 12, 2023
Fork of ICE-7(Line Chart)
Mar 12, 2023
Fork of Reusable scatter plot with different symbols
Mar 12, 2023
Fork of Reusable D3 Scatter Plot
Mar 11, 2023
Penguins Dataset scatter fork
Mar 8, 2023
Female Birth Rates Of states in United states
Mar 8, 2023
Student Performance in exam ICE5
Mar 2, 2023
Fork of Fork of Let's make a face with D3.js!
Feb 23, 2023
Fork of Fork of Let's make a face with D3.js!
Feb 23, 2023
Fork of Fork of Let's make a face with D3.js!
Feb 22, 2023
Fork of Fork of Let's make a face with D3.js!
Feb 22, 2023