Search
Pricing
Resources
Log in
Chase Hall
@itsyaboichase
Public vizzes
Starred vizzes
Public vizzes
Sort by
Most recent
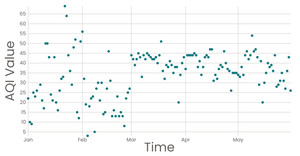
AQI Data in Bangor, Maine Over Time
7
Forks
1
Star
Chase Hall
Dec 07, 2022
new data with json
Chase Hall
Dec 07, 2022
Fork of React + D3 Viz Starter
Chase Hall
Dec 06, 2022
new data with json
Chase Hall
Dec 06, 2022
Fork of Stylized Line Chart
6
Forks
Chase Hall
Dec 05, 2022
Fork of map with aqi data with histogram
1
Fork
Chase Hall
Dec 05, 2022
Fork of Fork of new data
2
Forks
1
Star
Chase Hall
Dec 02, 2022
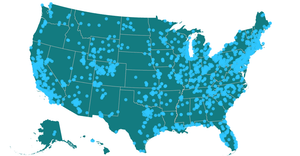
map of epa data sites
11
Forks
1
Star
Chase Hall
Dec 02, 2022
new data
2
Forks
Chase Hall
Dec 02, 2022
Fork of new data
3
Forks
1
Star
Chase Hall
Dec 02, 2022
Untitled
Chase Hall
Dec 02, 2022
Practice Face
1
Fork
Chase Hall
Dec 02, 2022
Untitled
Chase Hall
Nov 18, 2022
AQI Data in America in 2021 with Histogram and Brushing
7
Forks
4
Stars
Chase Hall
Nov 18, 2022
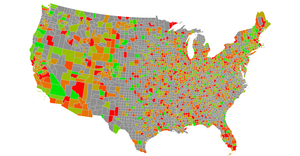
Fork of Pollution in US with counties by React and d3
2
Forks
Chase Hall
Nov 18, 2022
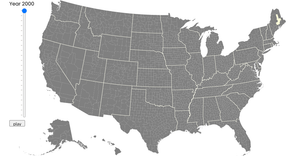
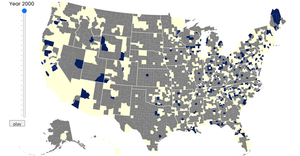
AQI Data in America by county
4
Forks
2
Stars
Chase Hall
Nov 08, 2022
Fork of Firefly Cartography
Chase Hall
Nov 03, 2022
map of epa data sites
Chase Hall
Nov 03, 2022
globe
Chase Hall
Oct 26, 2022
Fork of Cheap Tricks for Interaction
Chase Hall
Oct 25, 2022
Fork of Choropleth Map
Chase Hall
Oct 25, 2022
Fork of D3 Git History Streamgraph
Chase Hall
Oct 25, 2022
map with aqi data
1
Fork
Chase Hall
Oct 18, 2022
AQI Data in America by State
6
Forks
1
Star
Chase Hall
Oct 18, 2022
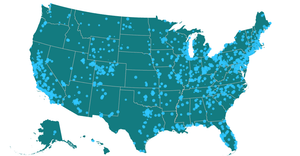
map with points
7
Forks
Chase Hall
Oct 18, 2022
EPA Recording sites
Chase Hall
Sep 30, 2022
Fork of AQI Data in America by county
Chase Hall
Aug 11, 2022
Fork of AQI Data in America by county
Chase Hall
Aug 11, 2022
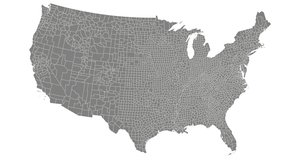
Fork of AQI Data in America by county
Chase Hall
Aug 11, 2022
Fork of Fork of Pollution in US with counties by React and d3
Chase Hall
Aug 11, 2022
map
3
Forks
Chase Hall
Aug 08, 2022
Fork of map with points
Chase Hall
Aug 05, 2022
Fork of Assignment 9: Choropleth Map
Chase Hall
Aug 04, 2022
rotatable globe
Chase Hall
Aug 04, 2022
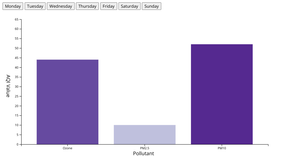
Example AQI Data Per Day of the Week
1
Fork
Chase Hall
Aug 04, 2022
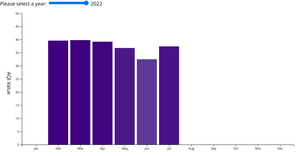
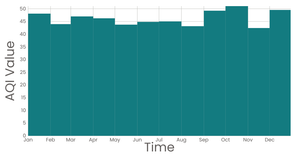
Average AQI Per Month in Bangor, Maine
Chase Hall
Aug 03, 2022
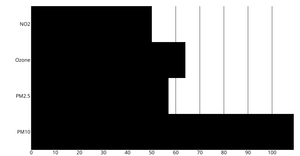
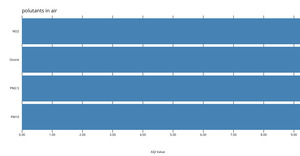
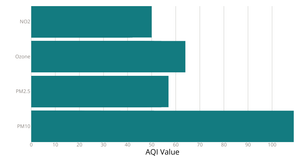
Example AQI Data in Bar Graph
2
Forks
Chase Hall
Aug 03, 2022
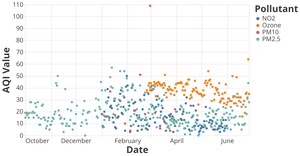
Example AQI Data in Scatter Plot
2
Forks
Chase Hall
Aug 03, 2022
parsing json data
Chase Hall
Aug 01, 2022
Json AQI Data in America with Histogram and Brushing
Chase Hall
Aug 01, 2022
Fork of Assignment 9: Choropleth Map
Chase Hall
Aug 01, 2022
AQI in America with Histogram
2
Forks
1
Star
Chase Hall
Jul 29, 2022
histogram for map
Chase Hall
Jul 29, 2022
AQI data in America over histogram
Chase Hall
Jul 28, 2022
Pollution Around America and Over Time
1
Fork
Chase Hall
Jul 28, 2022
histogram graph for map
Chase Hall
Jul 27, 2022
AQI data in america
1
Fork
Chase Hall
Jul 27, 2022
Migrant Deaths Linked Views with Fast Brushing using csv file
Chase Hall
Jul 26, 2022
.json to .csv
Chase Hall
Jul 25, 2022
Fork of Assignment 9: Choropleth Map
Chase Hall
Jul 22, 2022
test321
Chase Hall
Jul 22, 2022
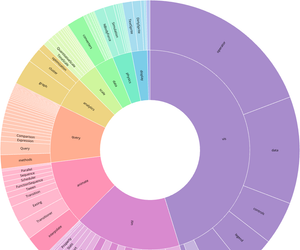
Fork of D3 v5 Zoomable Sunburst
Chase Hall
Jul 21, 2022
Document
1
Fork
Chase Hall
Jul 21, 2022
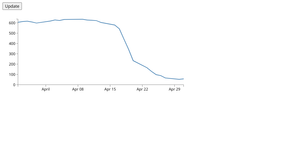
US Estimated Crime Data (1995 - 2015): Top 5 States
Chase Hall
Jul 21, 2022
Untitled
1
Fork
Chase Hall
Jul 19, 2022
Scatter Plot with Menus
Chase Hall
Jul 18, 2022
Stylized Line Chart
2
Forks
Chase Hall
Jul 18, 2022
10Green Line Graph Template
Chase Hall
Jul 15, 2022
10 green graph template with menus
Chase Hall
Jul 15, 2022
Fork of React Starter
Chase Hall
Jul 15, 2022
backup bar chart
1
Fork
Chase Hall
Jul 14, 2022
bar graph exsample
Chase Hall
Jul 13, 2022
Fork of Making a Bar Chart
Chase Hall
Jul 13, 2022
tests
Chase Hall
Jul 13, 2022
interactive graph
Chase Hall
Jun 30, 2022
Loading and Parsing CSV Data
Chase Hall
Jun 29, 2022
Loading data with react and d3
Chase Hall
Jun 29, 2022
mouse follower
1
Fork
Chase Hall
Jun 28, 2022
practice viz
Chase Hall
Jun 28, 2022
123
Chase Hall
Jun 28, 2022
practice project
Chase Hall
Jun 28, 2022