Resources
Contact
Pricing
🇺🇸
EN
Log in
Open Editor
Revision History
Export Image
Share
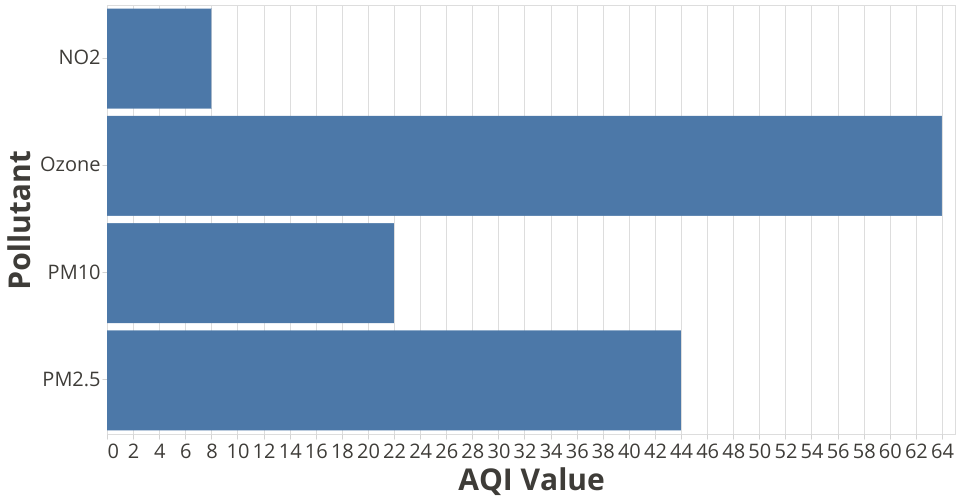
bar graph exsample
0
Forks
0
Likes
Chase Hall
0 views in last 90 days
Last edited Jul 13, 2022
Created on Jun 29, 2022
Forked from
Example AQI Data in Scatter Plot
uses
v2 runtime
A visualization constructed using the
vega-lite-api
.
MIT Licensed