Skip to main content
Explore
Solutions
Services
Pricing
Quick Start
Demo
Start free
Log in
Send feedback
✕
Tell us what works and what could be better. We read every submission.
Send feedback
✕
Tell us what works and what could be better. We read every submission.
H
He Jianfeng
@hjfrun
·
27 public vizzes
Selecting a Year on a Line Chart
Apr 16, 2021
Melting Data for Multiple Lines
Apr 16, 2021
Line Chart with Multiple Lines
Apr 15, 2021
Circles on a Map
Apr 15, 2021
Scatter Plot with Menus
Apr 14, 2021
Choropleth Map with Interactive Filtering
Apr 14, 2021
Choropleth Map
Apr 11, 2021
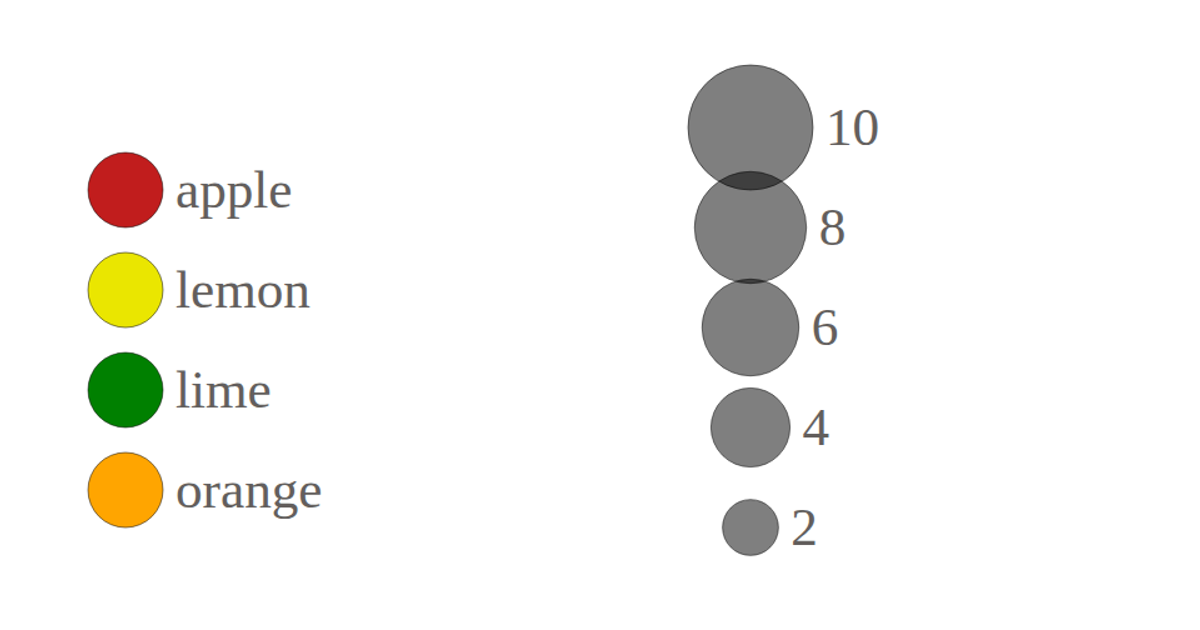
Color and Size Legends
Apr 11, 2021
World Countries Tree
Apr 11, 2021
Blank Canvas
Apr 11, 2021
Cheap Tricks for Interaction
Apr 8, 2021
Let's make a map with D3.js
Apr 8, 2021
Bowl of Fruit - Hover to Select
Apr 8, 2021
Bowl of Fruit - Click to Select
Apr 8, 2021
Bowl of Fruit - Nested
Apr 8, 2021
Bowl of Fruit - General Update Pattern
Apr 8, 2021
World Population Area Chart
Apr 8, 2021
Temperature in San Franciso Area Chart
Apr 8, 2021
Temperature in San Franciso Line Chart
Apr 8, 2021
Temperature in San Franciso Scatter Plot
Apr 8, 2021
Cars Scatter Plot
Apr 8, 2021
Scatter Plot
Apr 8, 2021
Making a Bar Chart v2
Apr 7, 2021
Making a Bar Chart
Apr 7, 2021
Let's make a face with D3.js
Apr 7, 2021
Hello D3
Apr 7, 2021
HTML Starter
Jan 10, 2020