🌍 Public
Cloropleth MAP
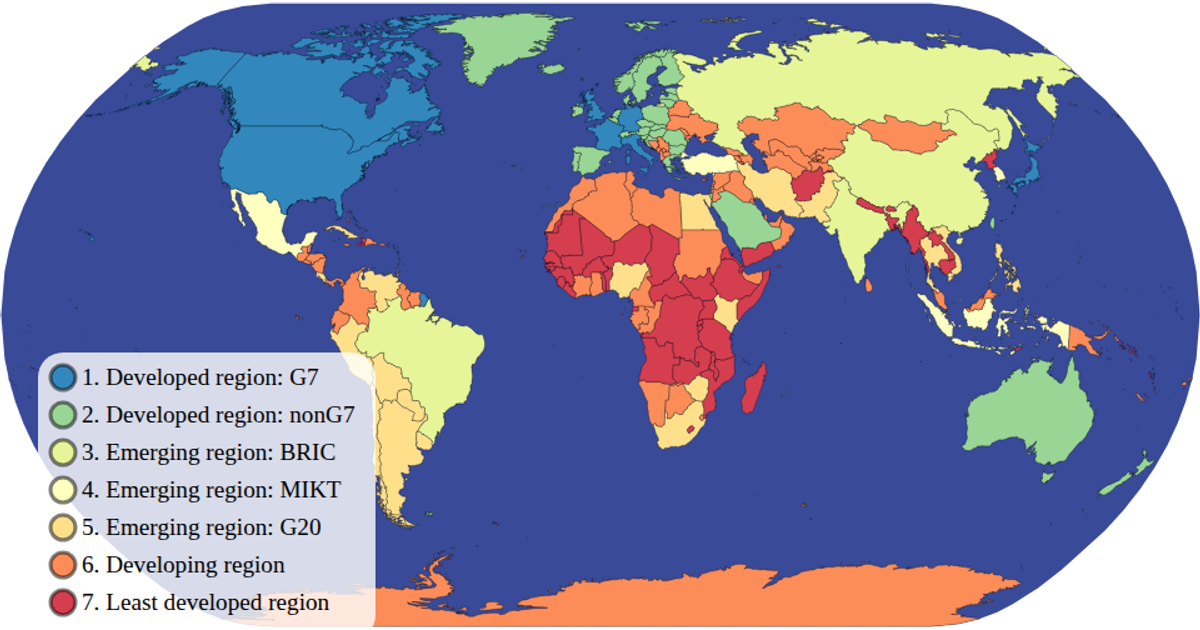
This choropleth map visualizes countries by economic classification using a natural Earth projection. A color legend built with `d3.scaleOrdinal` and `schemeSpectral` maps each income group to a distinct hue, while hovering highlights a country in red. The map supports zooming and panning via `d3.zoom`. Data comes from the World Atlas TopoJSON and TSV files, rendered as SVG paths with `d3.geoPath`.
AI-generated descriptionMIT Licensed




Comments
Sign in to join the discussion.