🌍 Public
Cloropleth Map
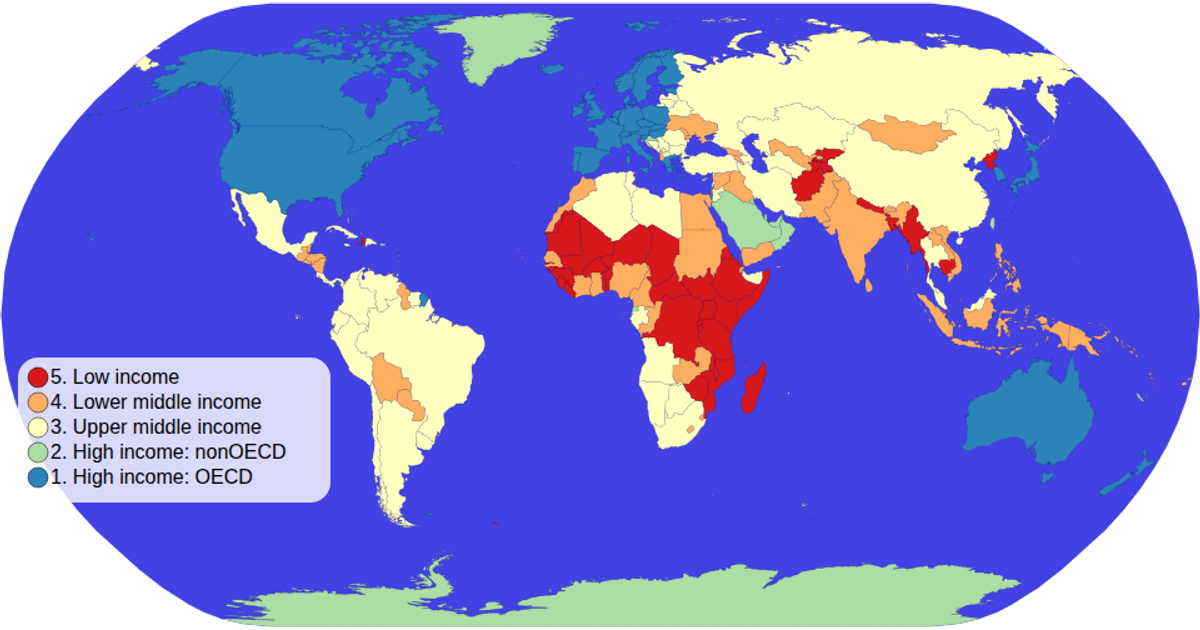
This choropleth map visualizes countries by income group, using color to encode each nation's categorical data. The map shows the geographical distribution of these groups across the world, with a color legend positioned on the left. It is built with D3 v5, using `d3.geoPath` with a `geoNaturalEarth1` projection to render world shapes from TopoJSON data loaded via the `world-atlas` package, which also provides TSV metadata for country names and income groups. A `scaleOrdinal` with a spectral color scheme drives the fill, while zooming and hover effects enhance interaction.
AI-generated descriptionMIT Licensed



Comments
Sign in to join the discussion.