🌍 Public
World map
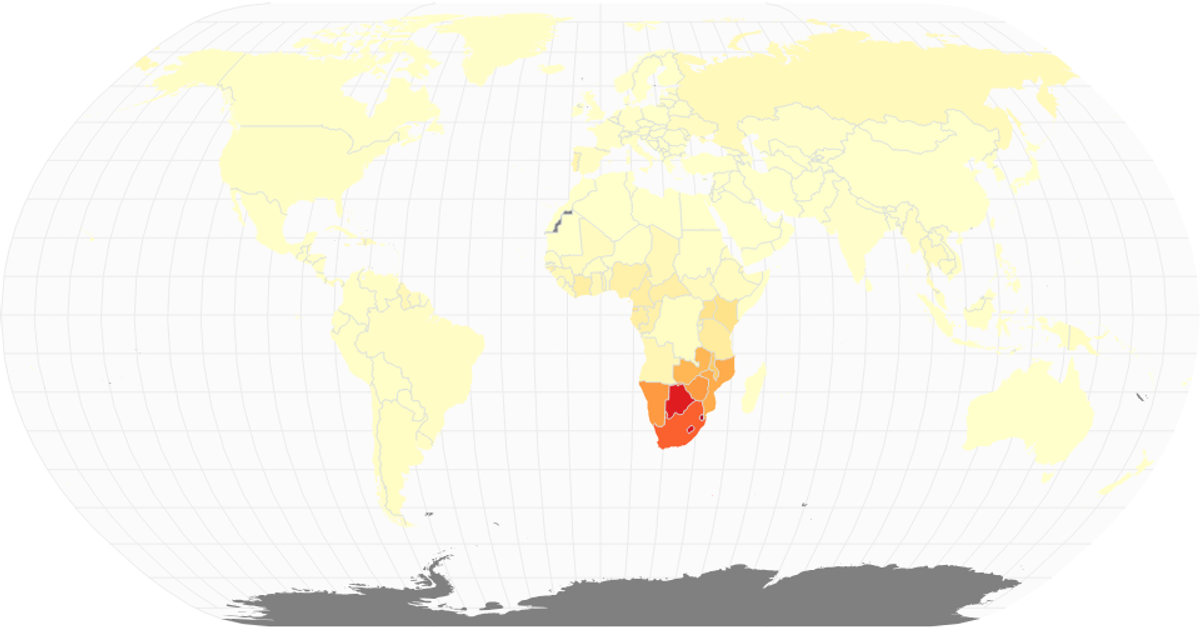
This example presents a world map visualizing HIV-infected people per country using 2021 data from the World Bank. Countries are colored with a green sequential scale based on infection counts, with hover tooltips displaying exact values and a legend explaining the ranges. Users can zoom and pan the map via d3.zoom. The visualization uses d3.geoNaturalEarth1 and d3.geoPath for geographic rendering, with topojson-client to load country boundaries from the visionscarto-world-atlas.
AI-generated descriptionA 2015 world map of HIV Infected People Dataset. This iteration adds hover and zoom.
MIT Licensed




Comments
Sign in to join the discussion.