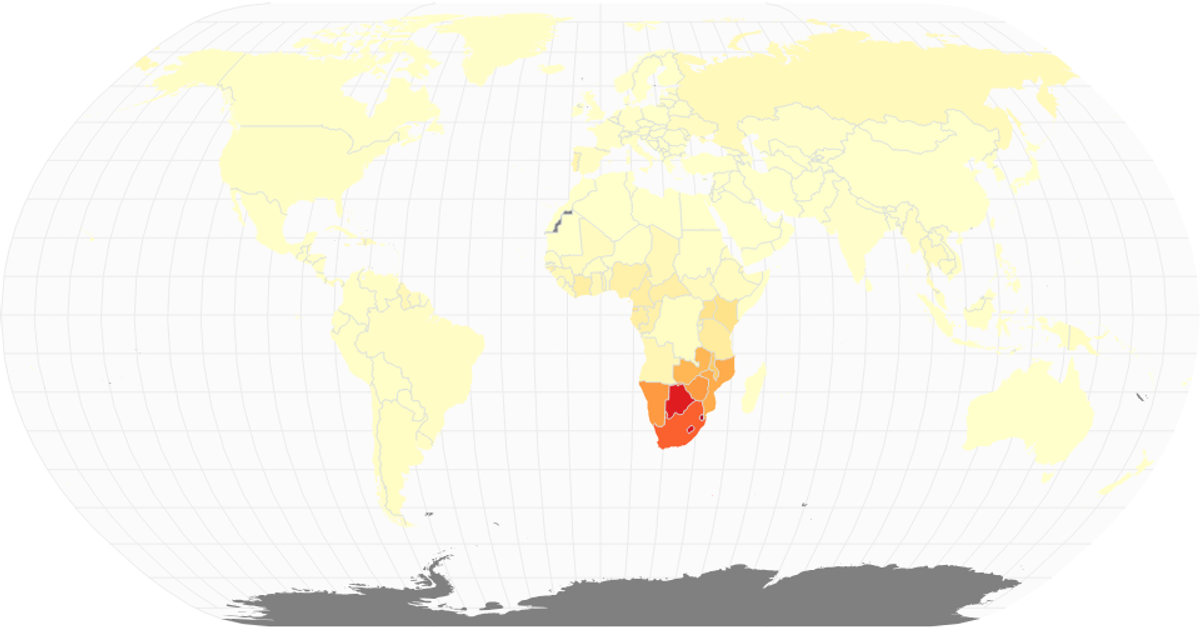
HIV / AIDS Choropleth Map
This visualization uses a natural Earth projection with D3’s `geoNaturalEarth1` and `geoPath` to draw world landmasses, graticules, and sphere outlines, overlaid with circles sized by city population via `scaleSqrt`. The React component loads World Atlas TopoJSON for boundaries and a CSV of HIV/AIDS prevalence data for cities, mapping each city’s longitude and latitude to screen coordinates. Semi-transparent teal circles highlight population distribution, while the underlying choropleth styling uses SVG paths and CSS classes. Data sources include the World Atlas TopoJSON and a Simplemaps-derived cities dataset.
AI-generated descriptionA world map showing cities with population greater than 50,000. City data from Simplemaps: World Cities Database.
Country boundaries from World Atlas TopoJSON, polished for visual style, including graticules.





Comments
Sign in to join the discussion.