🌍 Public
D3 Playground
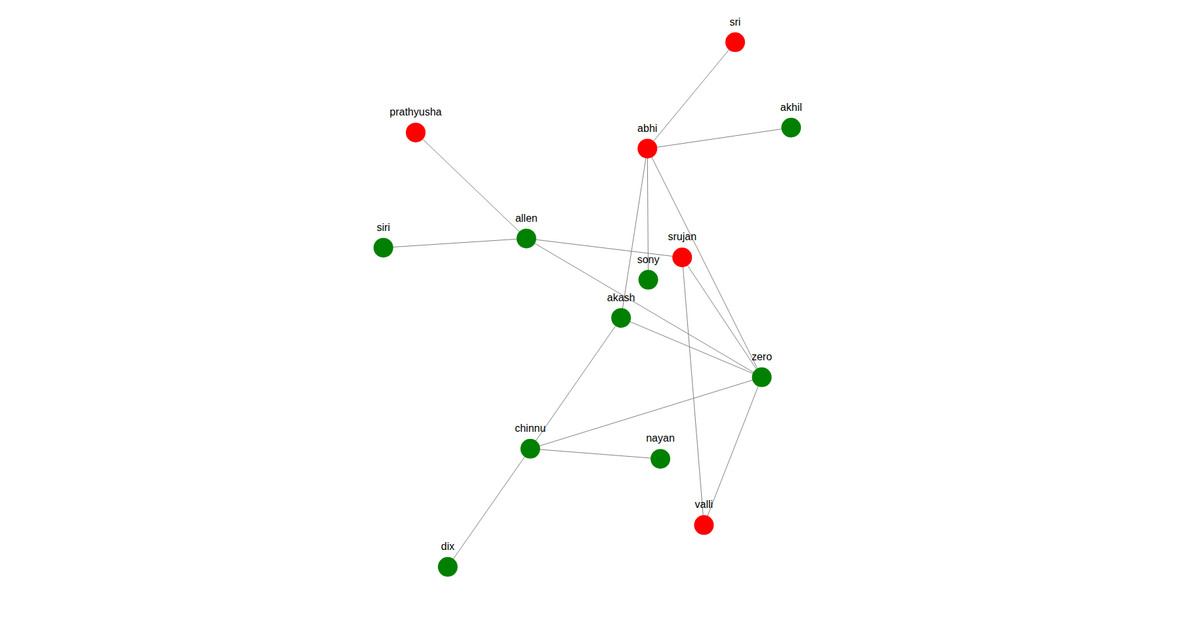
A force-directed graph shows the network of connections between Kenneth Rainin Foundation grantees, with four colored main nodes linking to child nodes and smaller unnamed leaves. The visualization uses D3 v6’s `forceSimulation`, `forceManyBody`, `forceLink`, and `forceCenter` to compute layout, rendering circles and text as SVG elements. A custom drag interaction lets users reposition nodes, while link distances and node sizes are defined in a data module with a generated color palette. The data comes from explicit JavaScript arrays, not an external dataset.
AI-generated descriptionA graph diagram representing the network of connections of the Kenneth Rainin Foundation.
MIT Licensed


Comments
Sign in to join the discussion.