🌍 Public
Network Graph Diagram
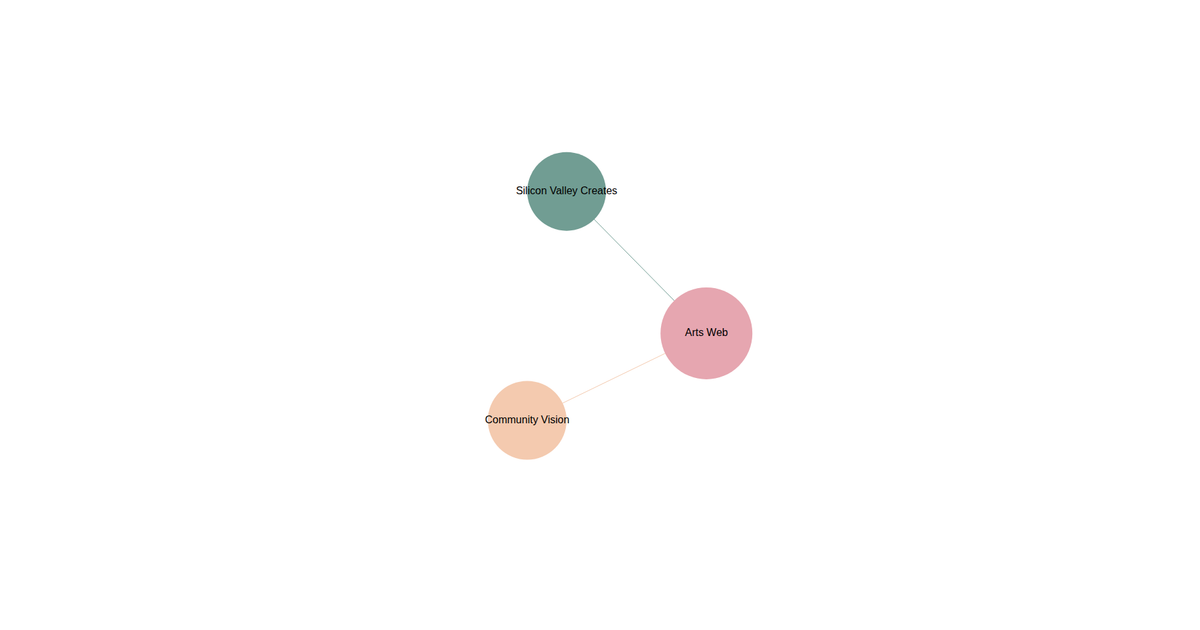
This example uses a network graph diagram to visualize connections within the Kenneth Rainin Foundation, displaying both main nodes and child nodes. Built with D3.js v6, it uses `d3.forceSimulation` with `forceManyBody`, `forceLink`, and `forceCenter` to position nodes that are rendered as SVG circles, with text labels for names. Links are drawn as lines, and the graph is interactive, supporting drag-and-drop via the `drag()` behavior and zooming through the `zoom()` handler. The data is defined in JavaScript, with node colors indicating checked status.
AI-generated descriptionA graph diagram representing the network of connections of the Kenneth Rainin Foundation.
MIT Licensed


Comments
Sign in to join the discussion.