🌍 Public
Question1.1-Venkat
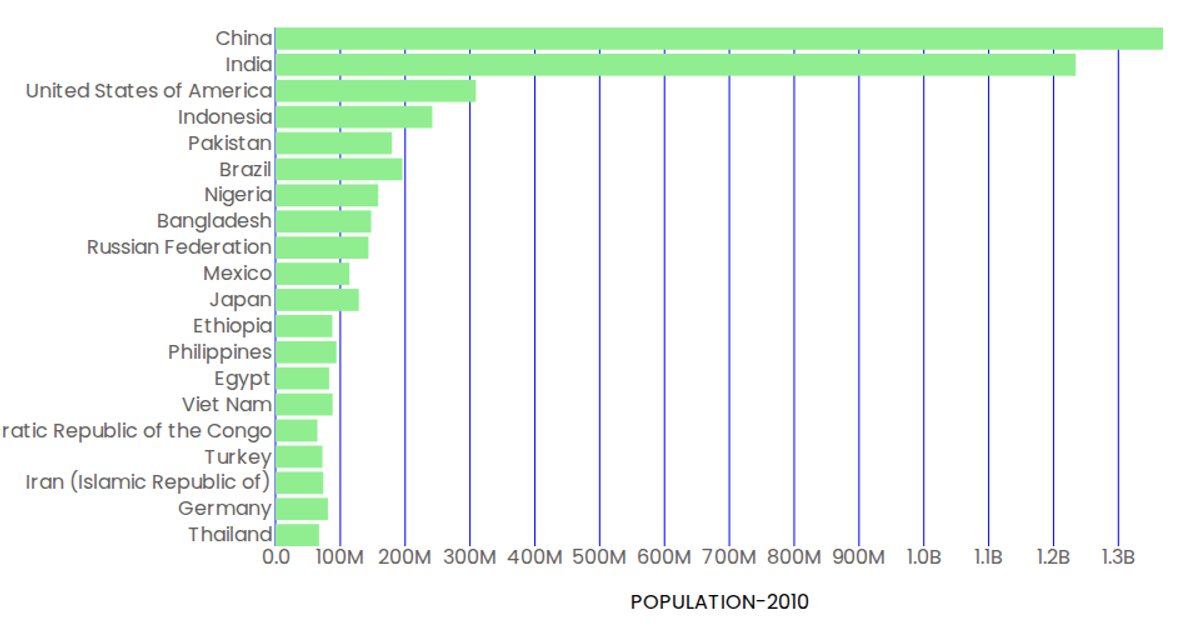
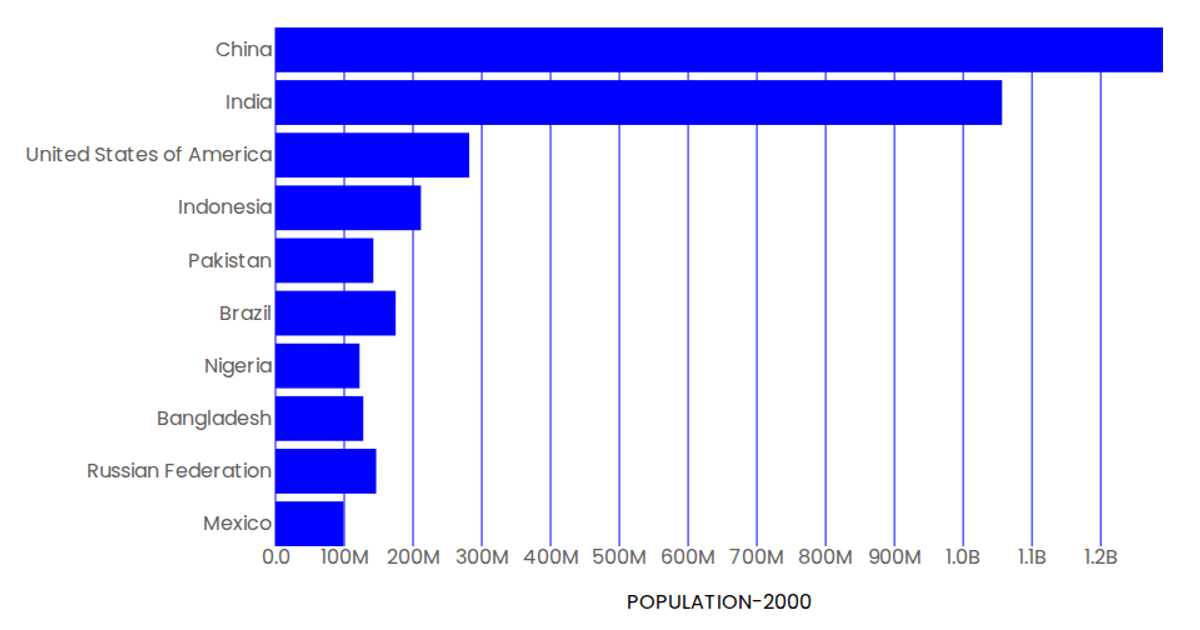
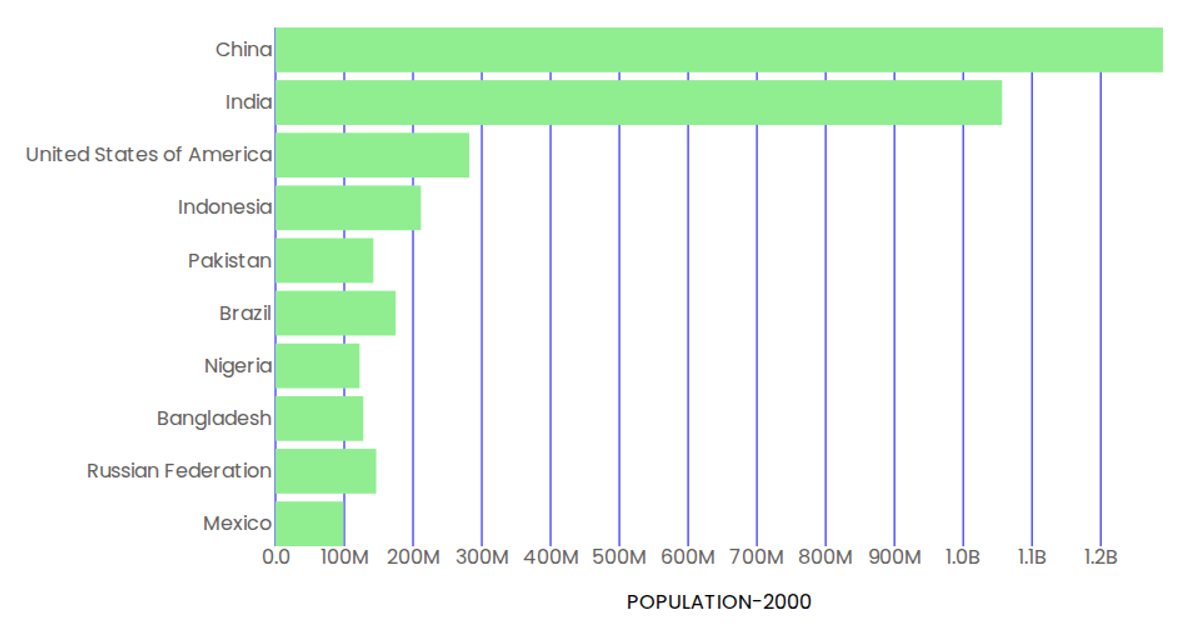
This horizontal bar chart visualizes population data for ten countries in the year 2000, using green bars over a plot with blue tick marks. The React application uses D3 v5 scales, including `scaleBand` for the categorical y-axis and `scaleLinear` for the quantitative x-axis, with a custom `siFormat` to abbreviate large numbers. The chart loads CSV data from a GitHub repository, maps it, and renders the axes and marks as SVG elements within a React component.
AI-generated descriptionA demonstration of how to start using D3 version 6.
MIT Licensed





Comments
Sign in to join the discussion.