🌍 Public
Activity-6_Question-1.1
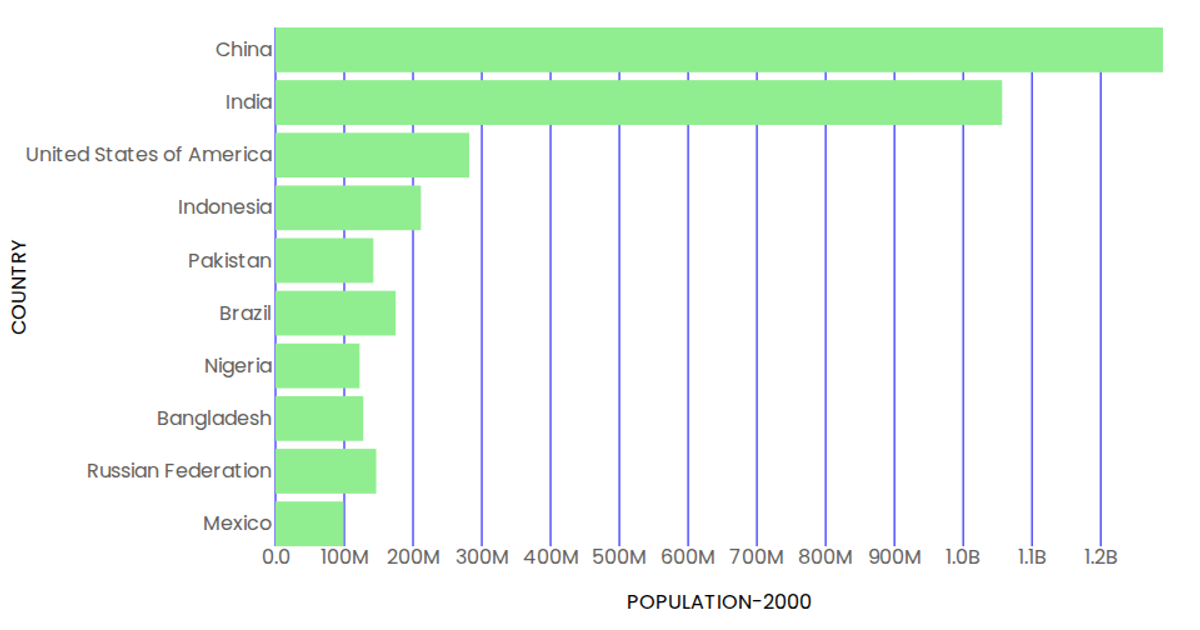
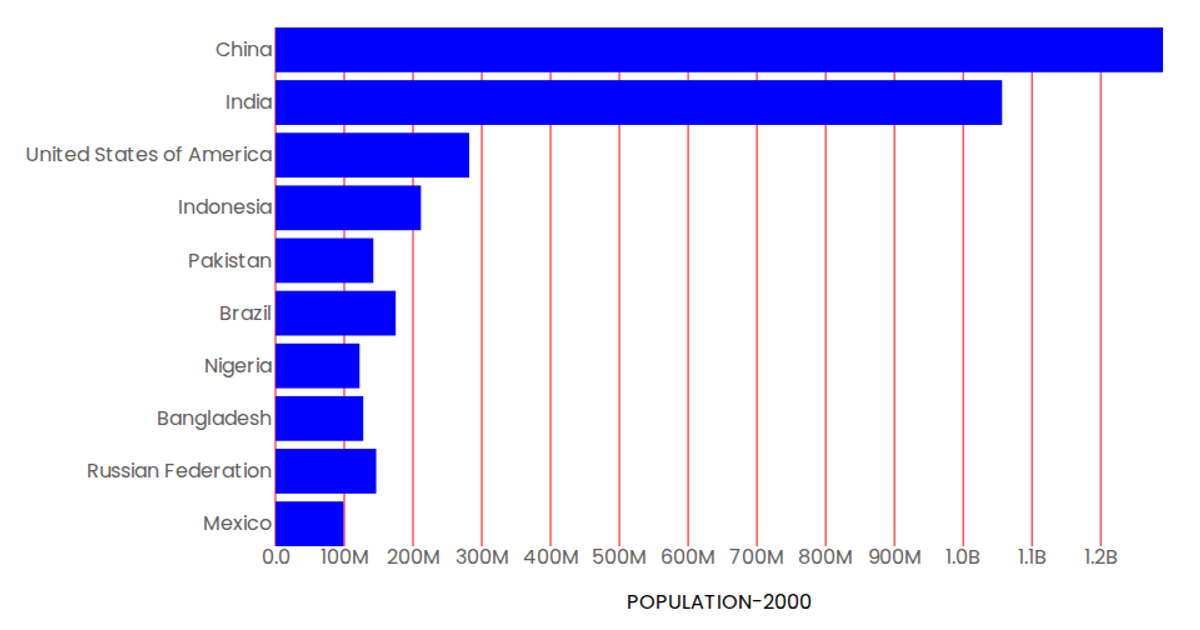
This example shows a horizontal bar chart of the population of the first ten countries in the year 2000, using data from a CSV file loaded with `d3.csv`. The chart uses `d3.scaleBand` for the categorical y-axis and `d3.scaleLinear` for the continuous population x-axis, rendering blue rectangles as bars via SVG. React and `d3` APIs manage the component state and data fetching, while tick labels are formatted with `d3.format`.
AI-generated descriptionCreating a bar graph using the vizHub to visualize the population for the first 10 countries in the year 2000.
MIT Licensed





Comments
Sign in to join the discussion.