🌍 Public
Sharanya Javvaji-Ice5
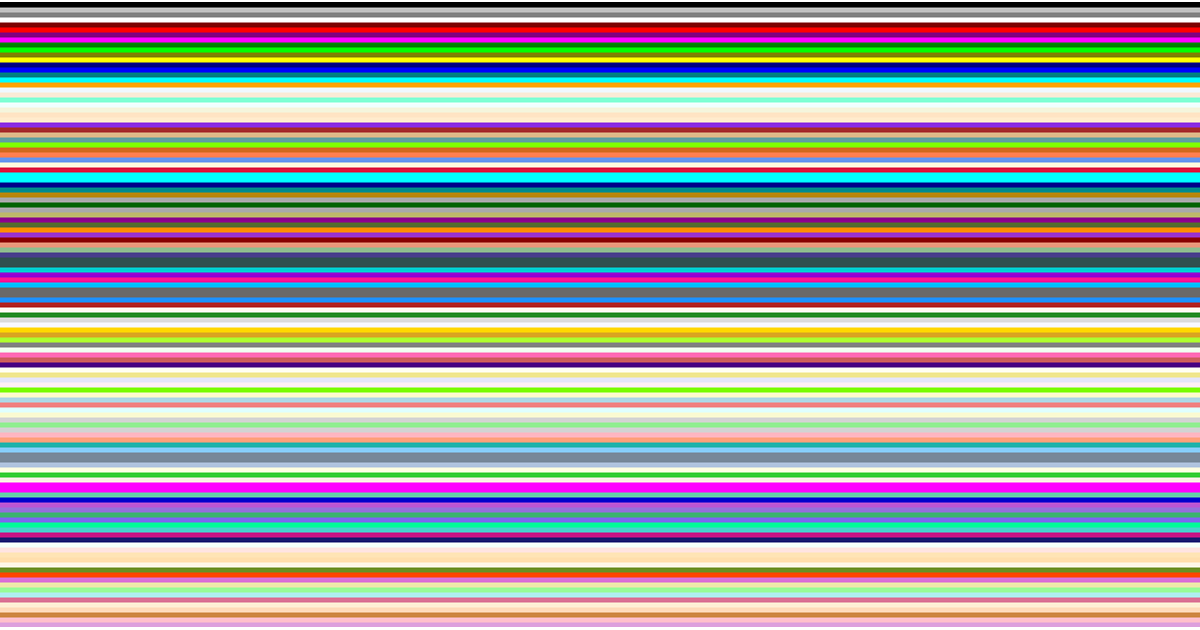
This visualization displays organizational data using CSS Named Colors loaded from a CSV file. It renders an SVG scene with a background pattern and data-driven visuals. The code uses D3 v7 to fetch and parse the CSV data with promises and async/await, then applies the color values to populate the organization chart.
AI-generated descriptionA program that loads and parses some CSV data: CSS Named Colors.
See also:
MIT Licensed






Comments
Sign in to join the discussion.