🌍 Public
Sharanya Sriram 11597311-Ice5
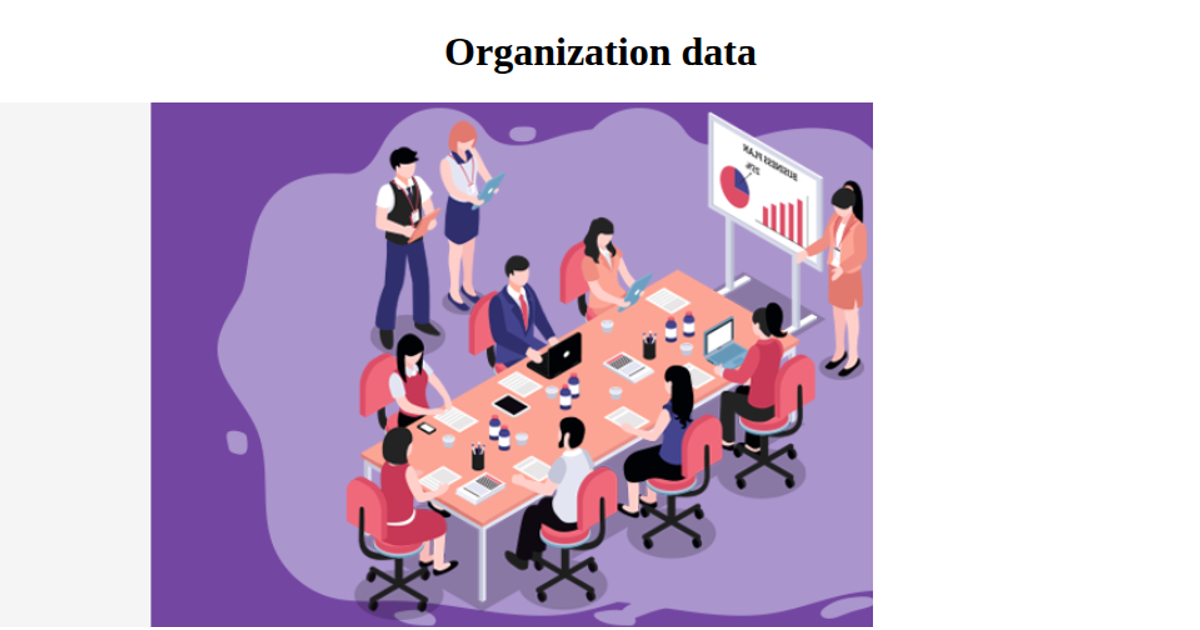
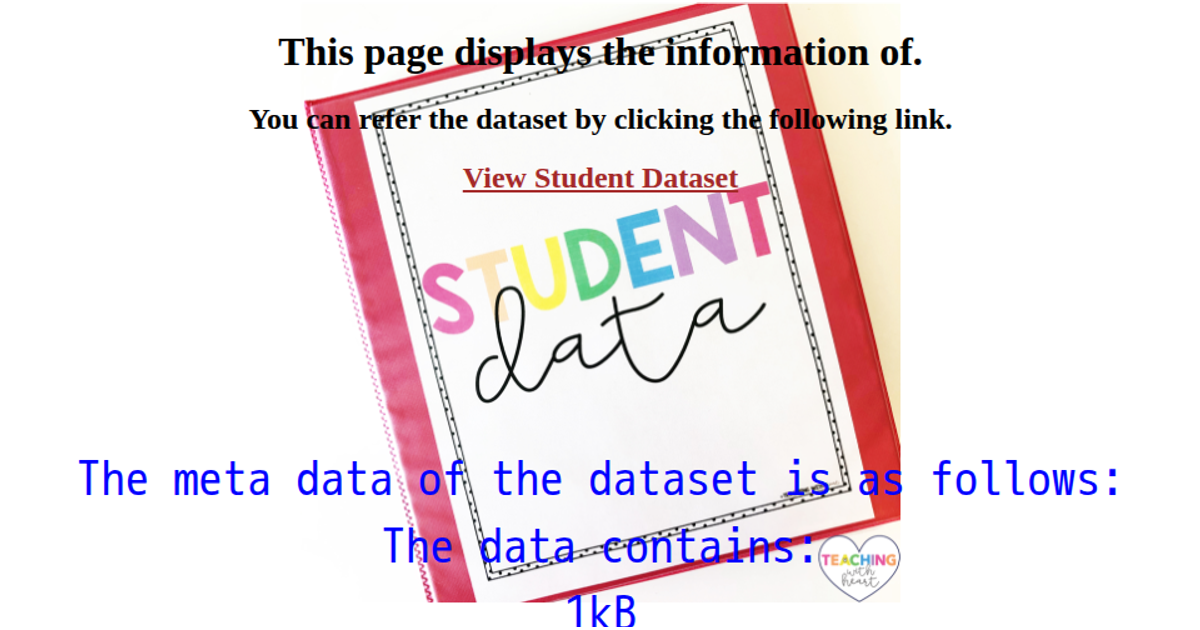
This visualization displays organizational data from a linked CSV file, showing dataset size in kilobytes, row count, and column count after loading. The graphic uses a basketball-reference.com-sourced background image, with D3.js (v7.3.0) handling CSV retrieval and formatting via `d3.csv` and `d3.csvFormat`. The SVG canvas remains unfilled, with information presented as text messages centered over the custom background.
AI-generated descriptionThe data from this graph is taken from basketball-reference.com
MIT Licensed





Comments
Sign in to join the discussion.