🌍 Public
Homepage
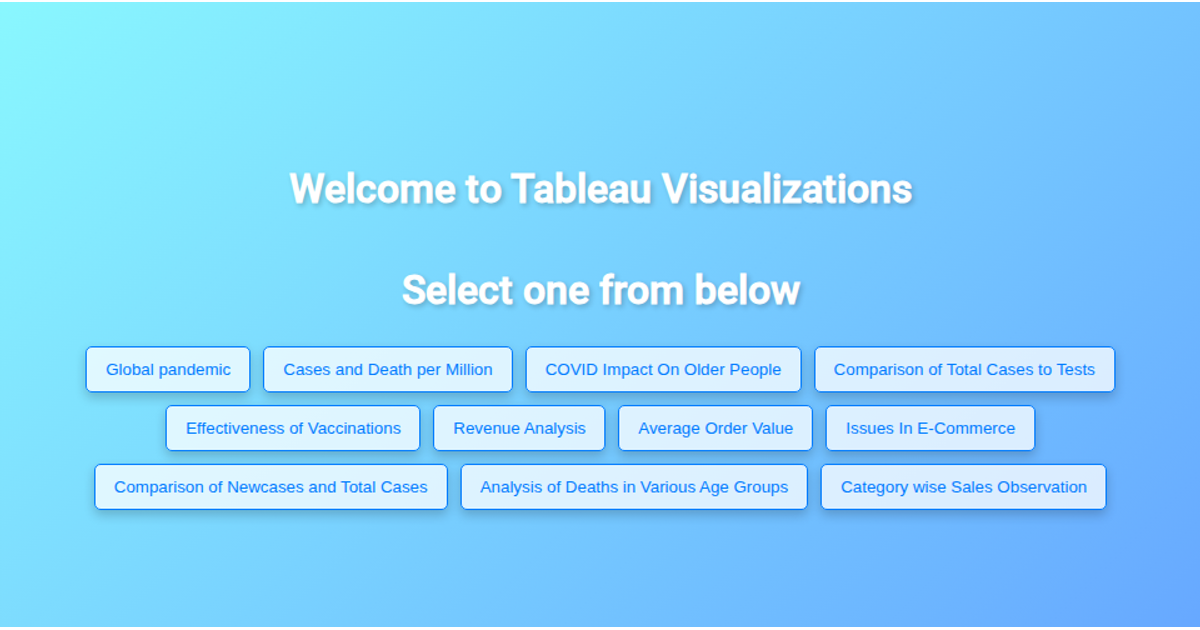
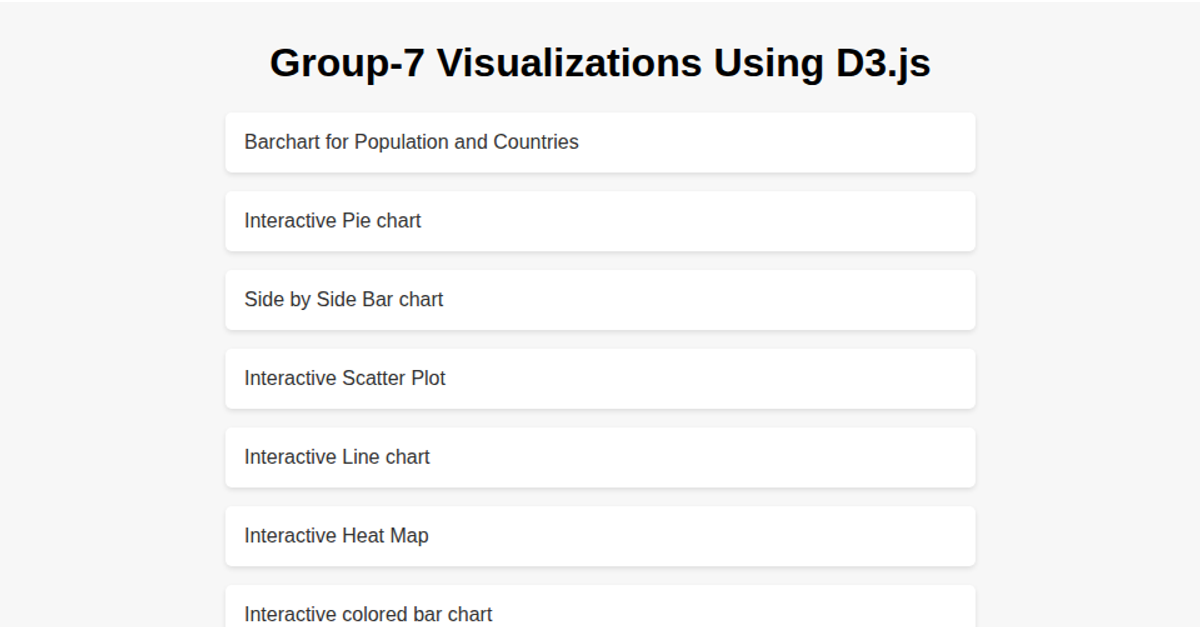
This homepage presents a curated collection of COVID-19 impact visualizations, linking to external dashboards for global case distributions, real estate, and retail sectors. The page uses plain HTML with JavaScript’s `window.location.assign` to redirect to a Tableau Public dashboard, while hyperlinks connect to VizHub-hosted interactive charts. Styling is handled with CSS for font sizing and emphasis. It does not render data directly, serving instead as a navigation hub for related visual projects.
AI-generated descriptionMIT Licensed




Comments
Sign in to join the discussion.