🌍 Public
Untitled
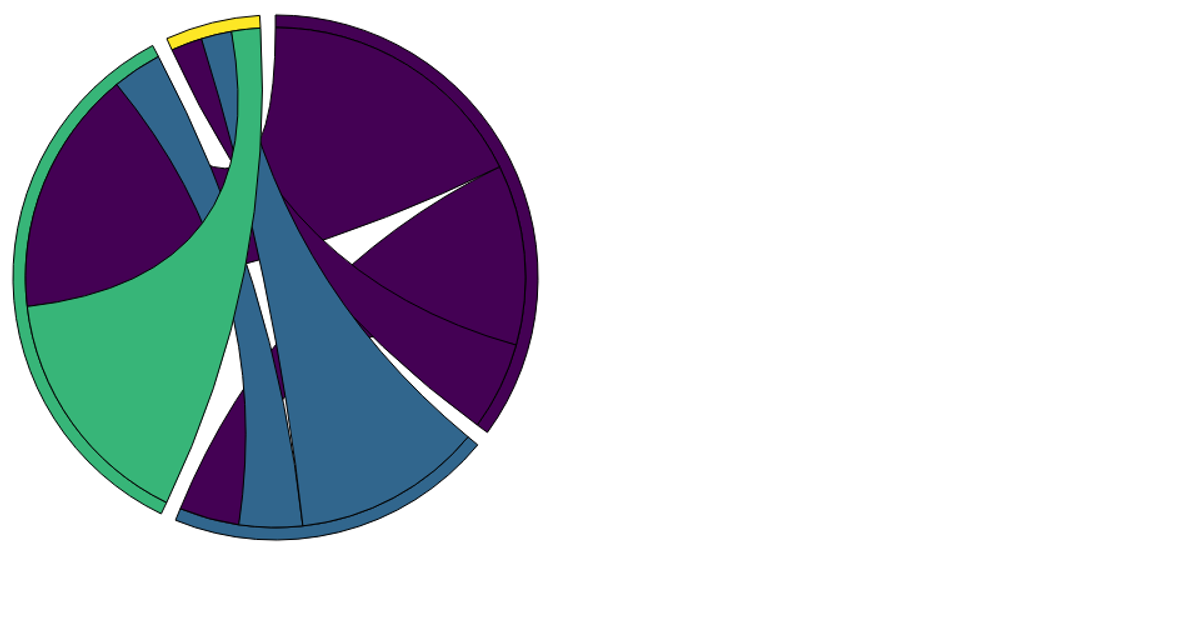
This example visualizes the flow of values between five European cities using an animated chord diagram. The circular layout shows directed connections, with ribbon thickness representing the magnitude of each value, ranging from small flows like Paris to Madrid (8) to larger ones like Amsterdam to Berlin (42). Built with amCharts 5, it uses the `am5flow.Chord` series within a root element and applies the `am5themes_Animated` theme. The chart sets data with source, target, and value fields, and triggers a load animation via the `appear()` method.
AI-generated descriptionA bare minimum HTML page demonstrating use of CSS and JavaScript.
See also React Starter.
MIT Licensed





Comments
Sign in to join the discussion.