🌍 Public
Activity6_Task3.2
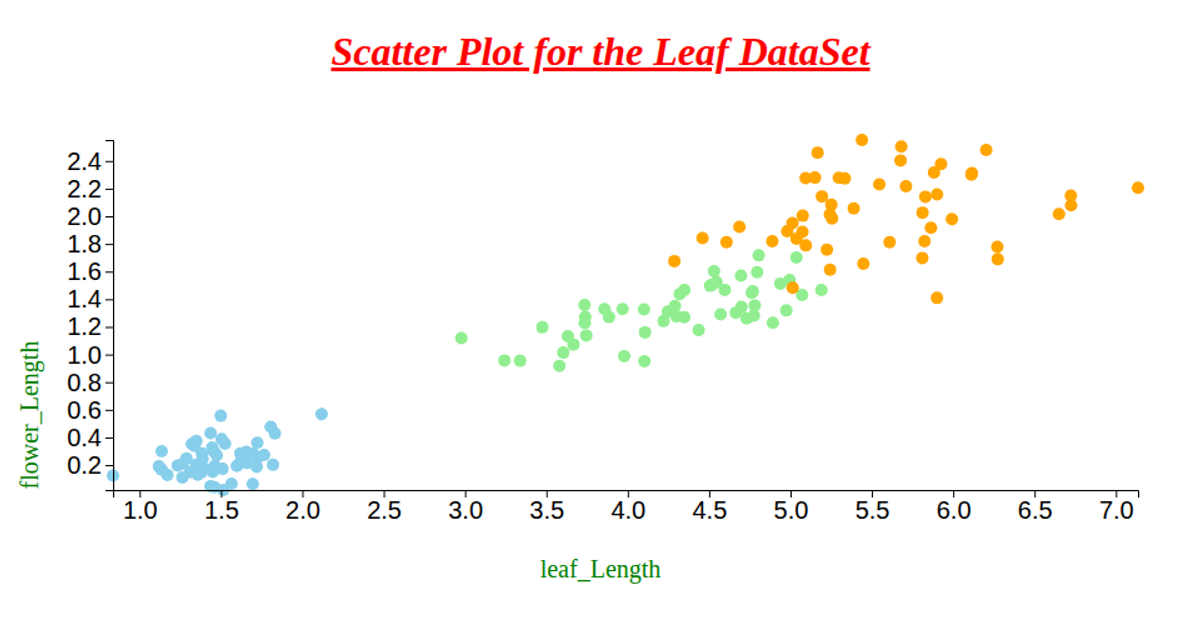
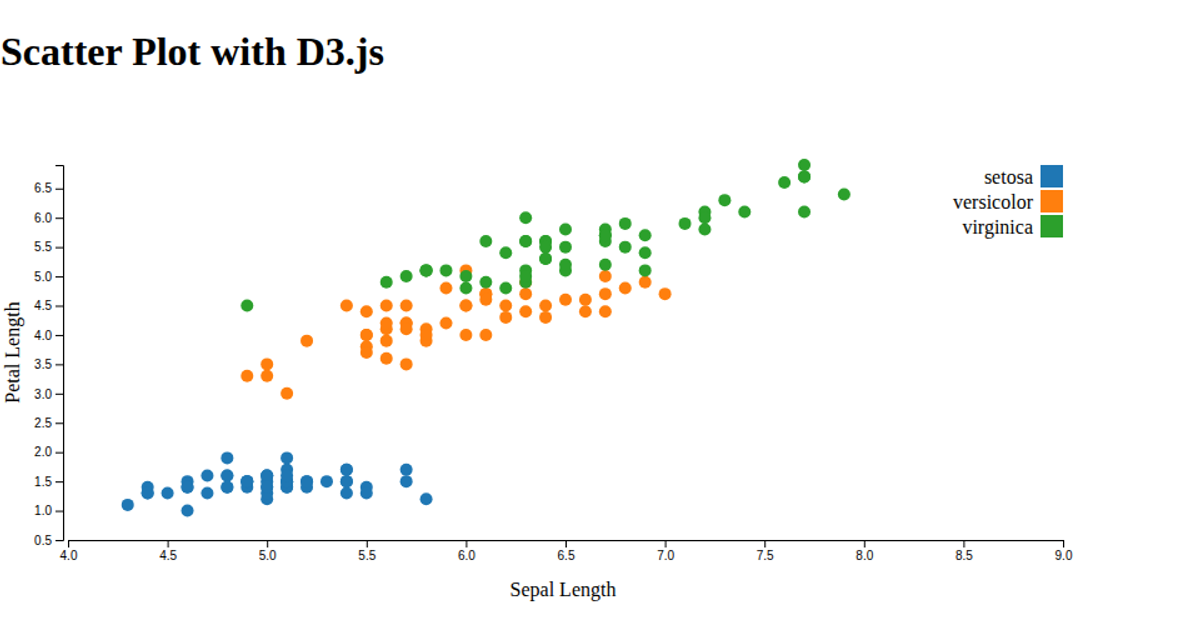
A scatter plot displays leaf length against stem height for plants, with each point’s shape encoding plant type via a d3.scaleOrdinal and symbol generator. The chart includes labeled axes from d3.axisBottom and axisLeft, plus a custom shape legend positioned at fixed coordinates. Data is loaded asynchronously from a GitHub CSV using d3.csvParse and rendered with d3.v7 selections.
AI-generated descriptionMIT Licensed




Comments
Sign in to join the discussion.