🌍 Public
QUESTION-3 (TASK-3)
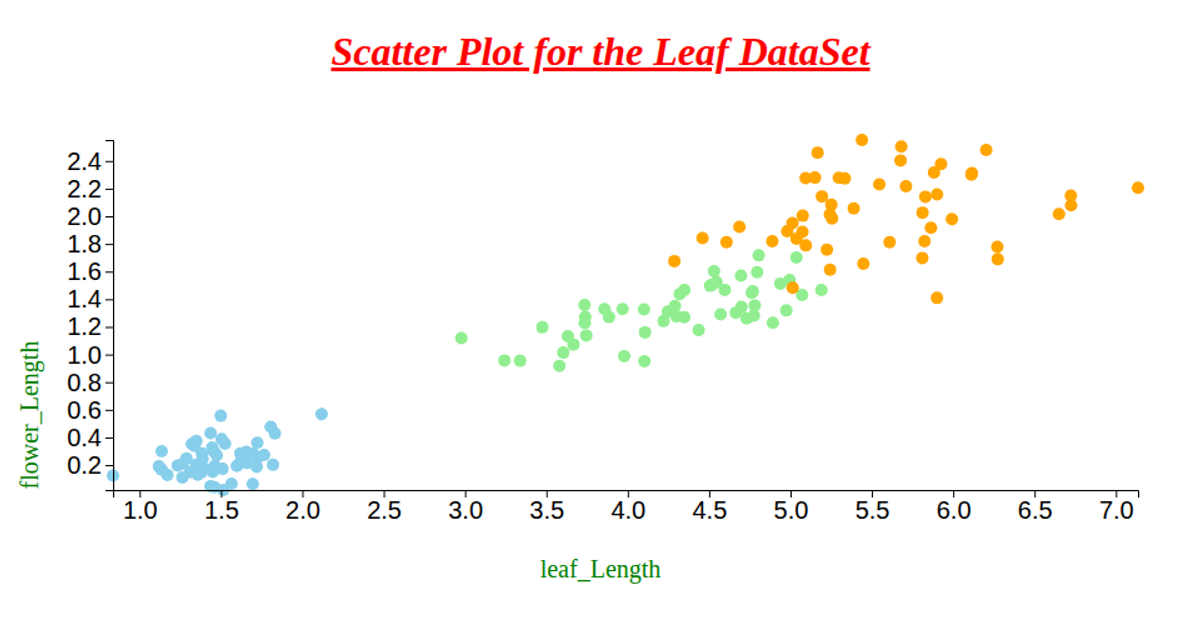
This scatter plot visualizes the relationship between leaf length and leaf width for 150 plants, with points colored by plant type (Type A, Type B, or other) using light green, blue, or yellow. The visualization uses D3 v6 with SVG rendering, employing `d3.csv` to load data from a GitHub-hosted CSV file, `d3.scaleLinear` for axes, and `d3.axisLeft`/`d3.axisBottom` to draw the labeled axes. Circle radii are fixed at 5 pixels, and the plot fills the entire browser window.
AI-generated descriptionMIT Licensed


Comments
Sign in to join the discussion.