🌍 Public
Fork of Animated Reusable D3 Scatter Plot
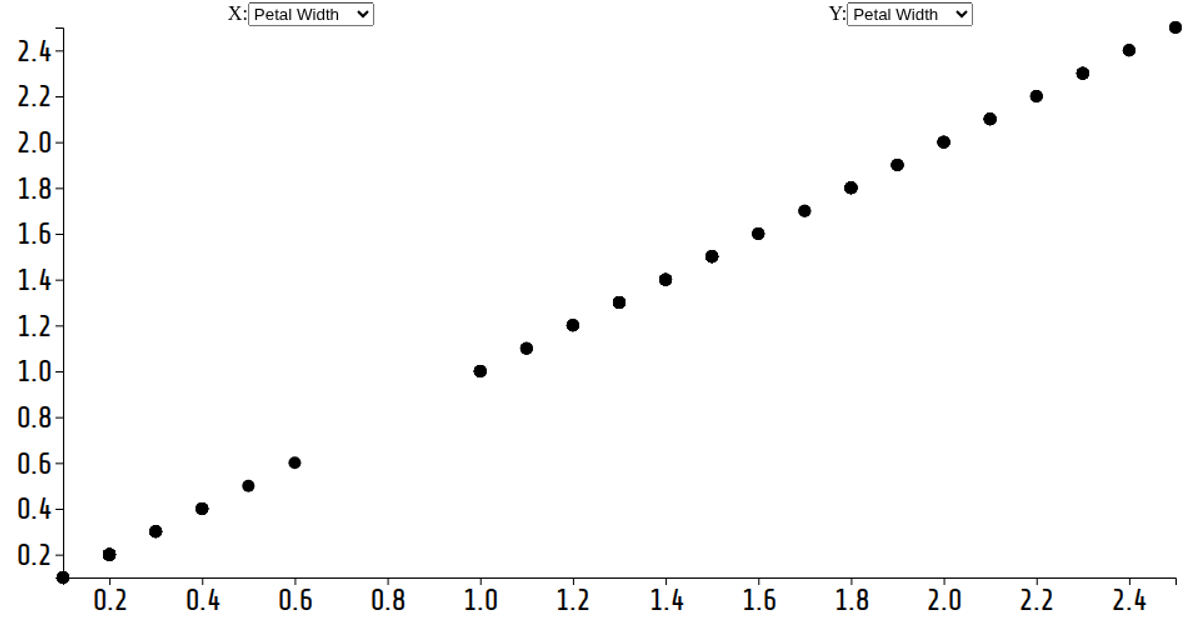
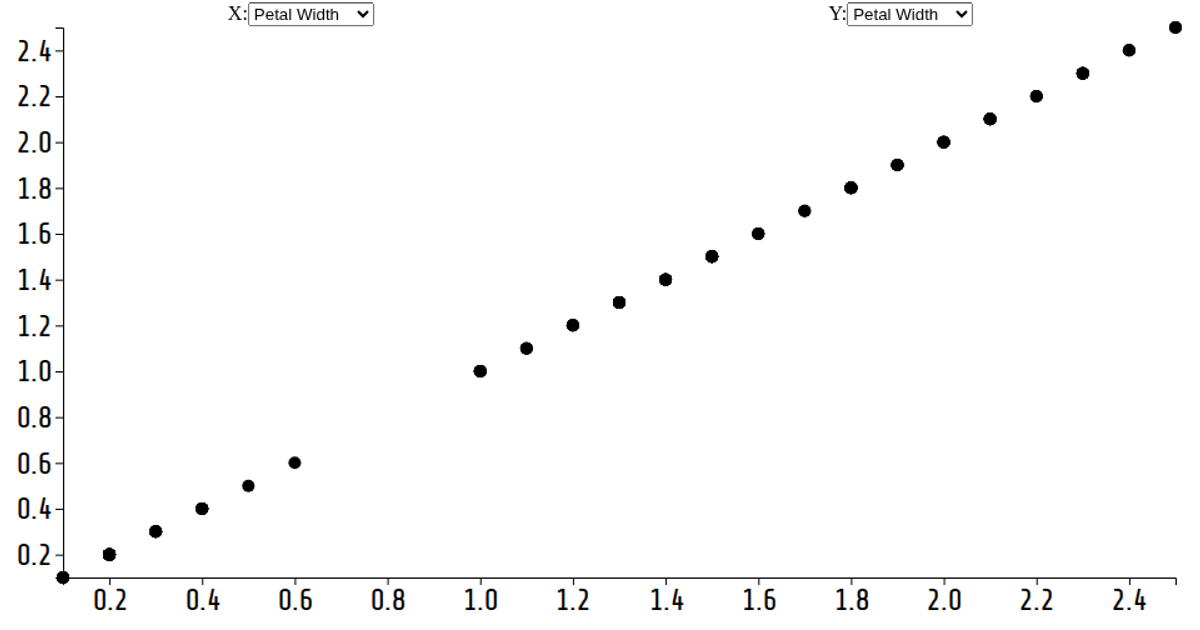
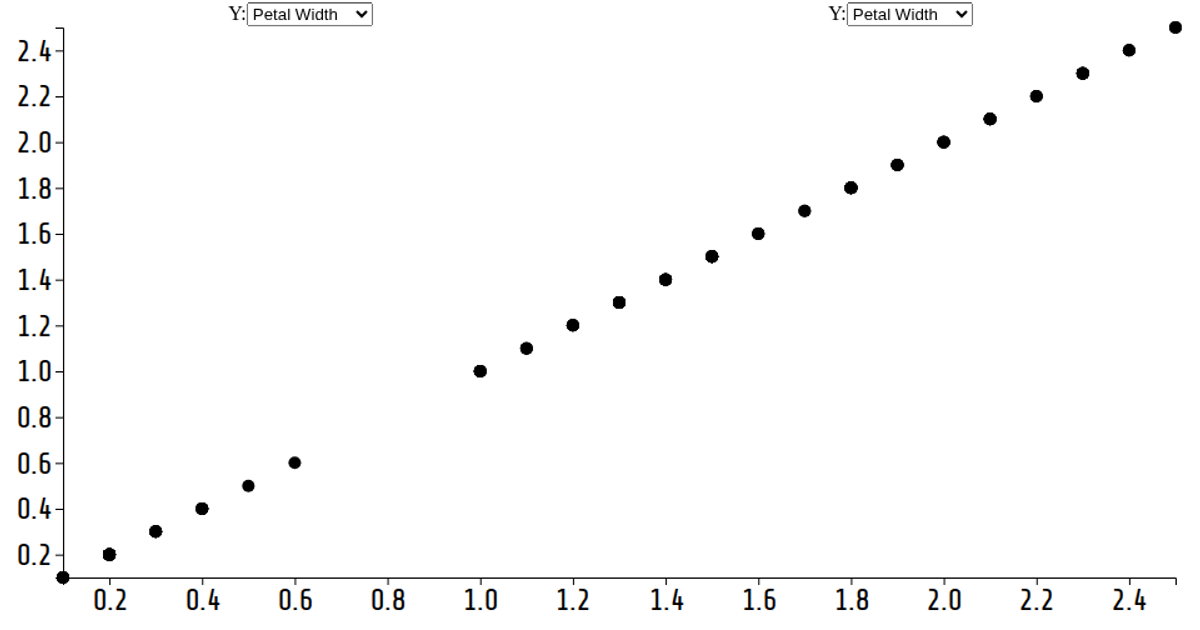
This example uses the Iris Dataset to demonstrate a reusable D3.js scatter plot with interactive axis selection. Users can dynamically change the x and y variables from quantitative measurements or the categorical species column via dropdown menus. The plot leverages `d3.scaleLinear` and `d3.scalePoint` for axes, with animations driven by `selection.join` and `transition` to smoothly move circles between positions. Menus are built with a custom `d3.dispatch`-based component, rendered as SVG in a full-viewport layout.
AI-generated descriptionA reusable scatter plot inspired by Towards Reusable Charts and Observable: selection.join.
Shows the Iris Dataset.
MIT Licensed




Comments
Sign in to join the discussion.