🌍 Public
D3 World Map III
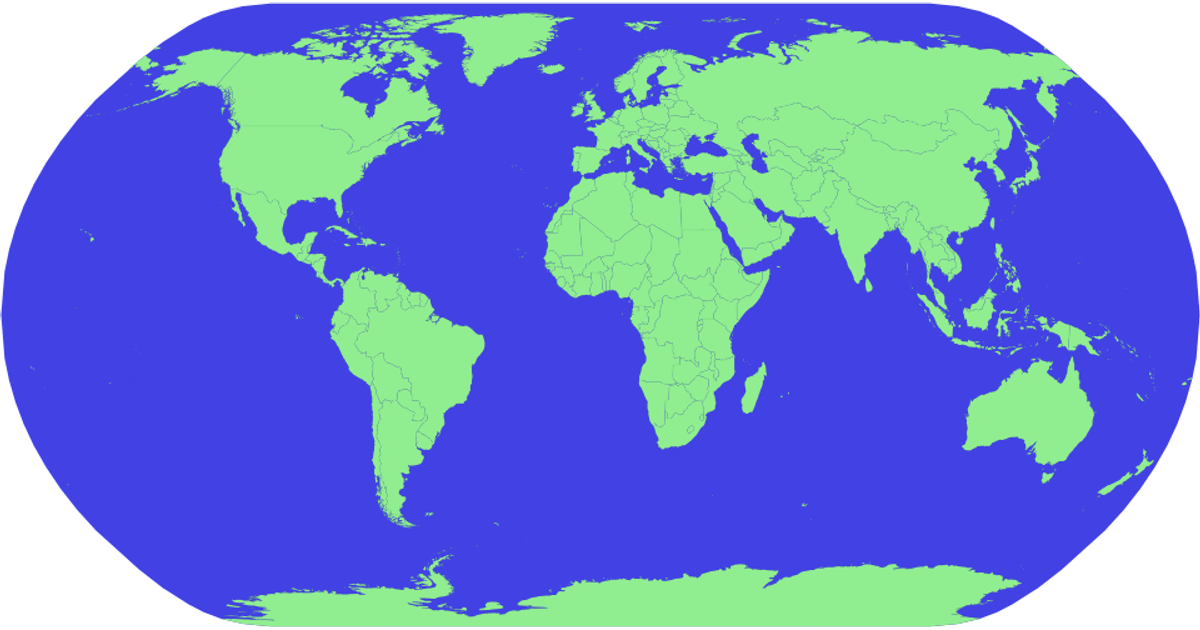
This example displays an interactive world map with countries rendered in light green against a light blue ocean. Users can pan and zoom the map using mouse or touch gestures, with a hover effect that highlights countries in red and reveals their names as tooltips. The visualization uses d3-geo with the geoNaturalEarth1 projection and d3.geoPath to draw SVG paths, while d3.zoom handles the interactive transformations. Geographic data comes from the world-atlas TopoJSON dataset, with country names loaded from a corresponding TSV file.
AI-generated description- Panning & Zooming
MIT Licensed




Comments
Sign in to join the discussion.