🌍 Public
Fork of DailyQA_may2
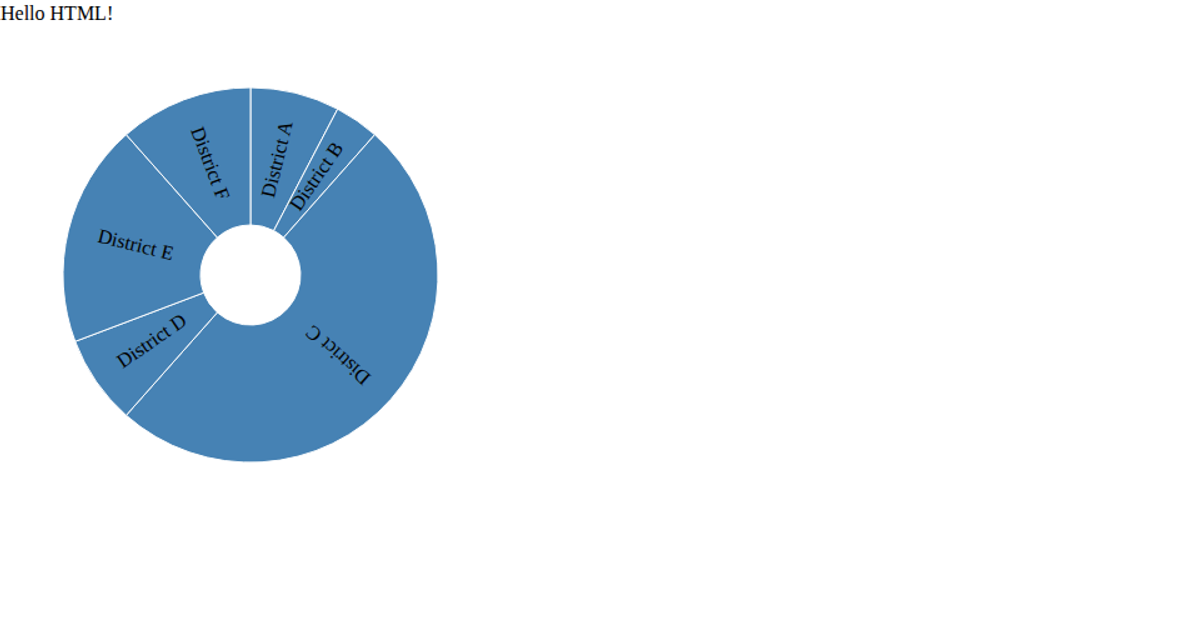
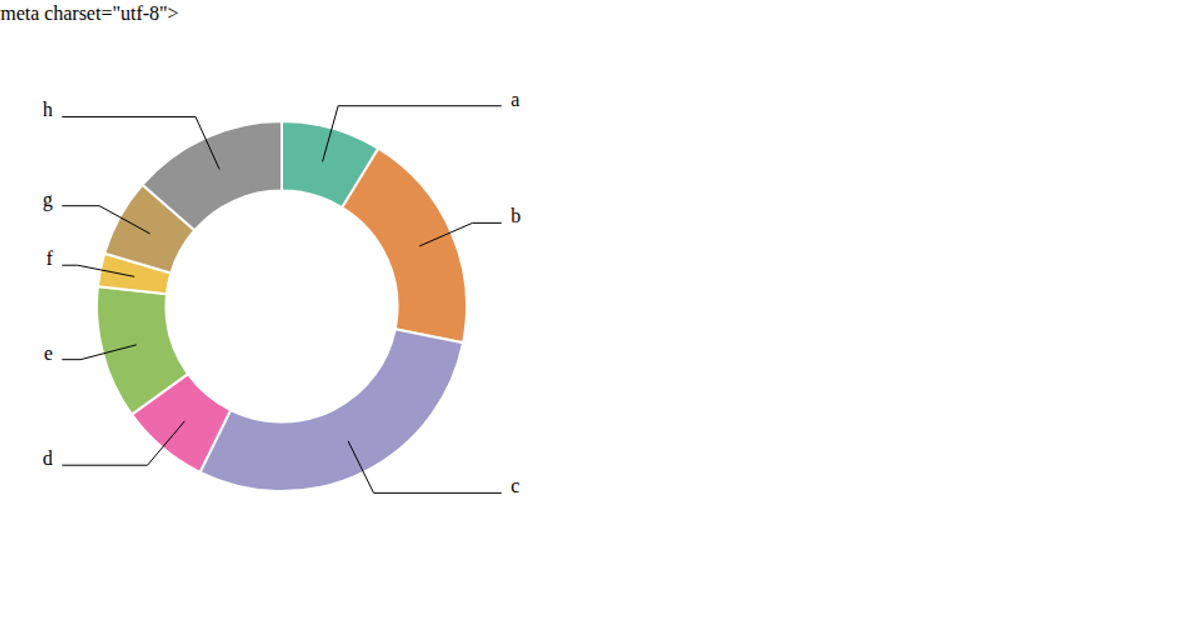
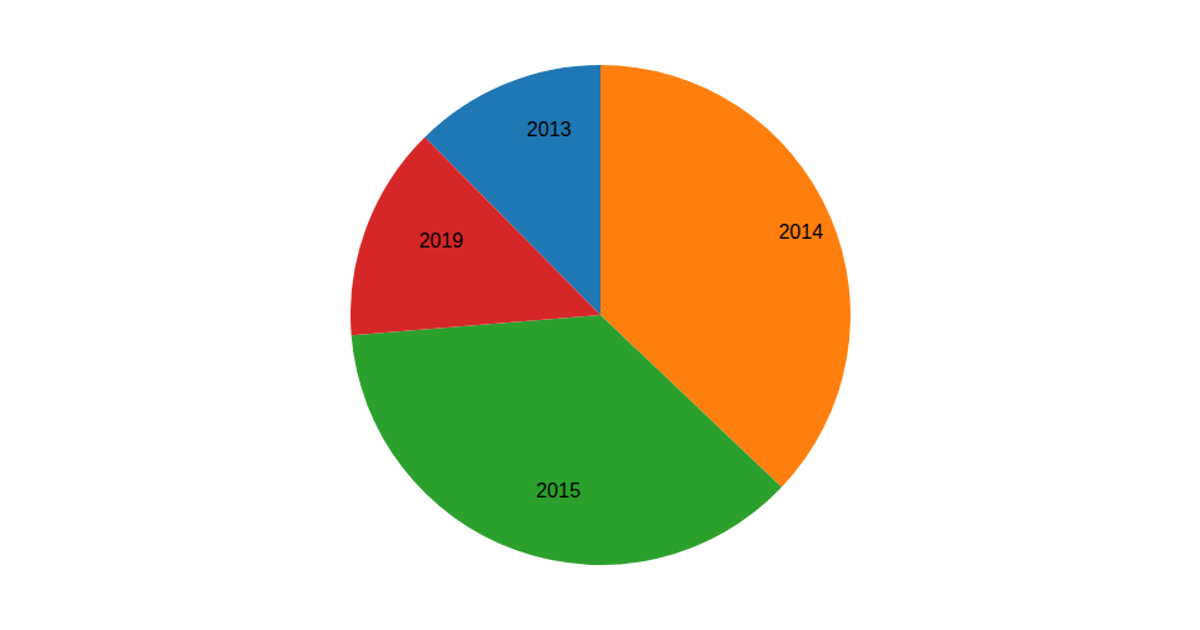
This example shows a static donut chart displaying five categorical values as colored slices with black outlines and partial opacity. The chart is rendered in an SVG generated with D3 v6, using `d3.pie()` and `d3.arc()` to compute slice geometry and `d3.scaleOrdinal()` for the categorical color scale. Dummy data is hardcoded in the script, and the visualization is centered within a fixed 450×450 pixel canvas. The code forks from a DailyQA project and includes no interactivity or animation.
AI-generated descriptionDaily QA Visualization in progress.
MIT Licensed





Comments
Sign in to join the discussion.