🌍 Public
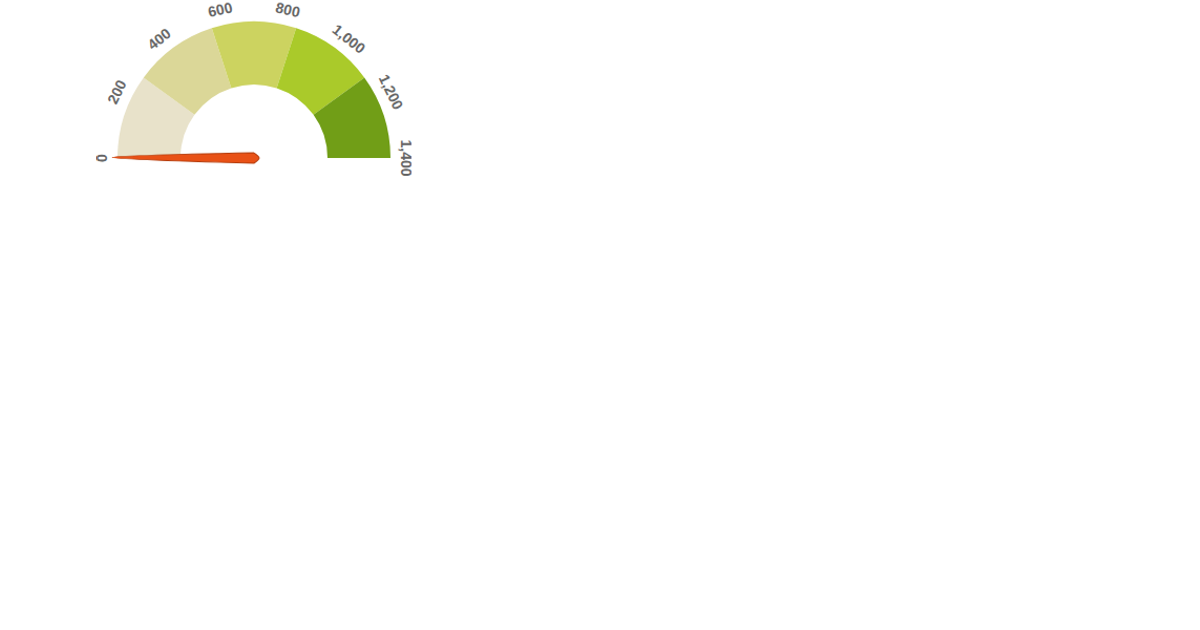
A gauge in D3.js with gradient generator
This gauge visualization displays six semicircular arcs around a central value readout, each shaded with a gradient that transitions between colors to represent different battery and power states. The code uses D3.js v5’s `arc` generator and `transition` method, building linear gradients via `svg.append('defs')` with `linearGradient` elements positioned using trigonometric calculations. A dark slate indicator arc and a white percentage text label update smoothly, while the SVG canvas is statically sized at 900×500 pixels.
AI-generated descriptionTest gauge with gradient generator
MIT Licensed




Comments
Sign in to join the discussion.