🌍 Public
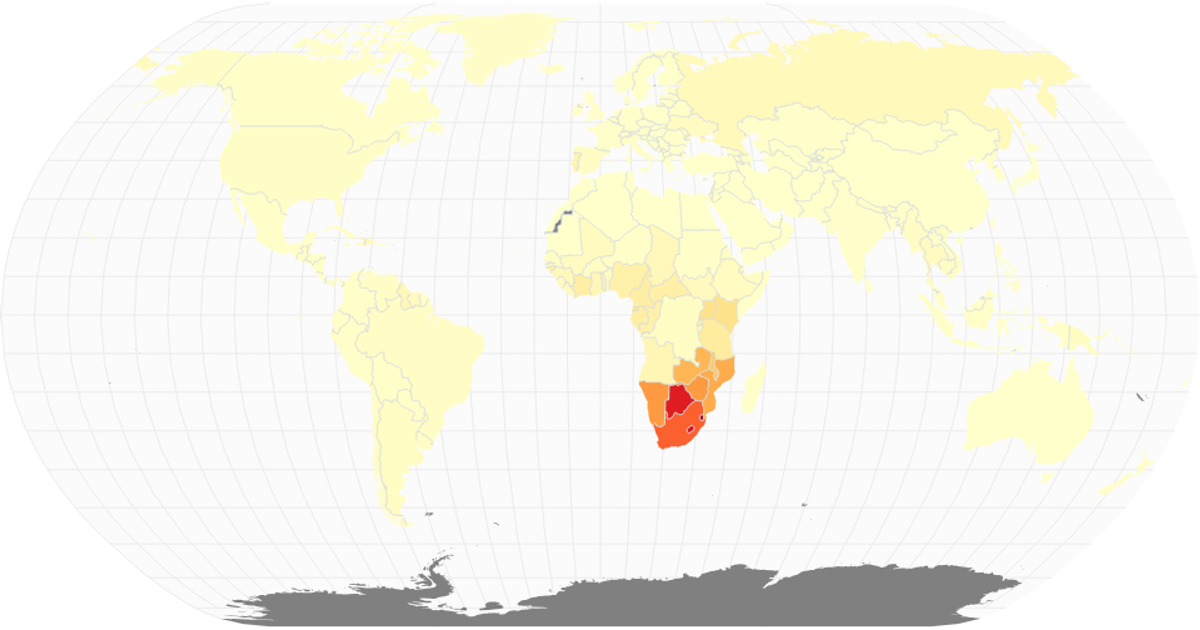
HIV/AIDS Choropleth Map
This choropleth map visualizes the global share of the population infected with HIV/AIDS among adults aged 15–49 in 2017. Country shading uses a sequential color scale interpolating Yellow-Orange-Red, with missing data rendered in gray. Built with React and D3 v7, the map projects geographic data using `geoNaturalEarth1` and renders paths via `geoPath`, with a graticule and interior borders for context. Data comes from the IHME CSV, joined to country codes and world atlas TopoJSON.
AI-generated descriptionA scatterplot that shows working with time data.
MIT Licensed




Comments
Sign in to join the discussion.