🌍 Public
Texas NOAA Summary of the Month 1946-2020 with Menus & Legend
AAndre J Denais
Last edited Mar 4, 2021
Created on Feb 18, 2021
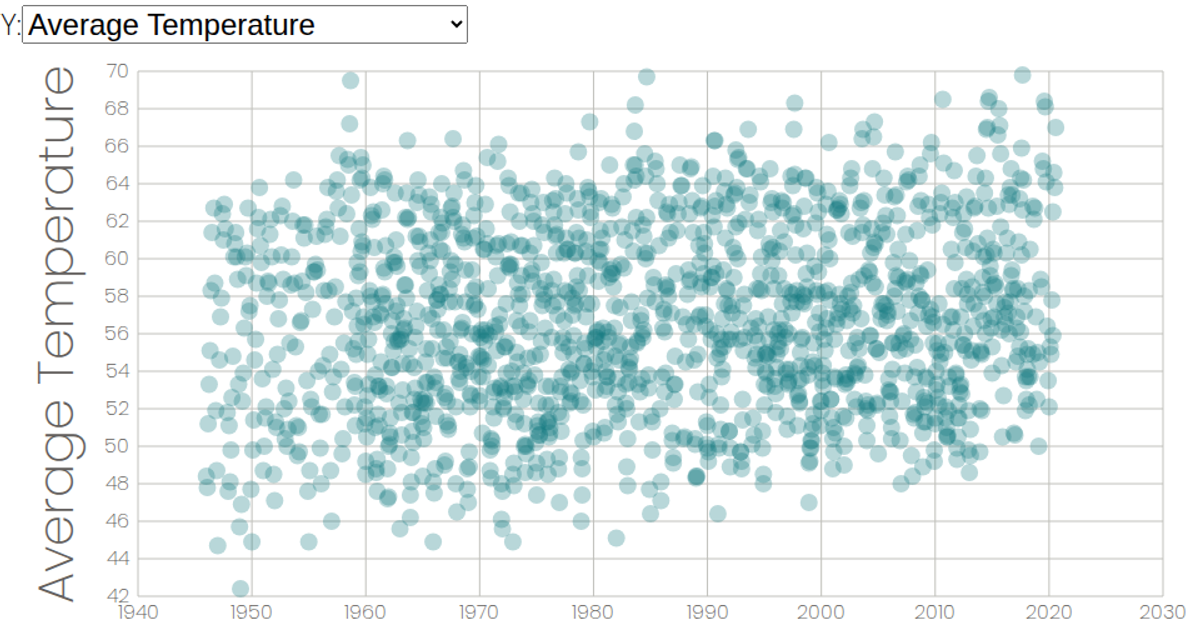
This interactive scatterplot displays Texas NOAA monthly climate summaries from 1946–2020, letting users switch which weather attribute is mapped to the y-axis via a dropdown menu. A color legend for weather stations highlights and fades data points on hover. Built with React and D3 v6, it uses `scaleTime`, `scaleLinear`, `scaleOrdinal`, and SVG circles for rendering, pulling CSV data from a GitHub gist.
AI-generated descriptionThis data was requested and collected from the NOAA.
Created using D3 and js, this time with a menu for the y axis.
MIT Licensed



Comments
Sign in to join the discussion.